Winter Solstice 2021 rendered in Catfood Earth (15:59 UTC, December 21, 2021). Winter begins in the northern hemisphere, summer if you happen to be south of the equator.
By Robert Ellison. Updated on Saturday, February 19, 2022.
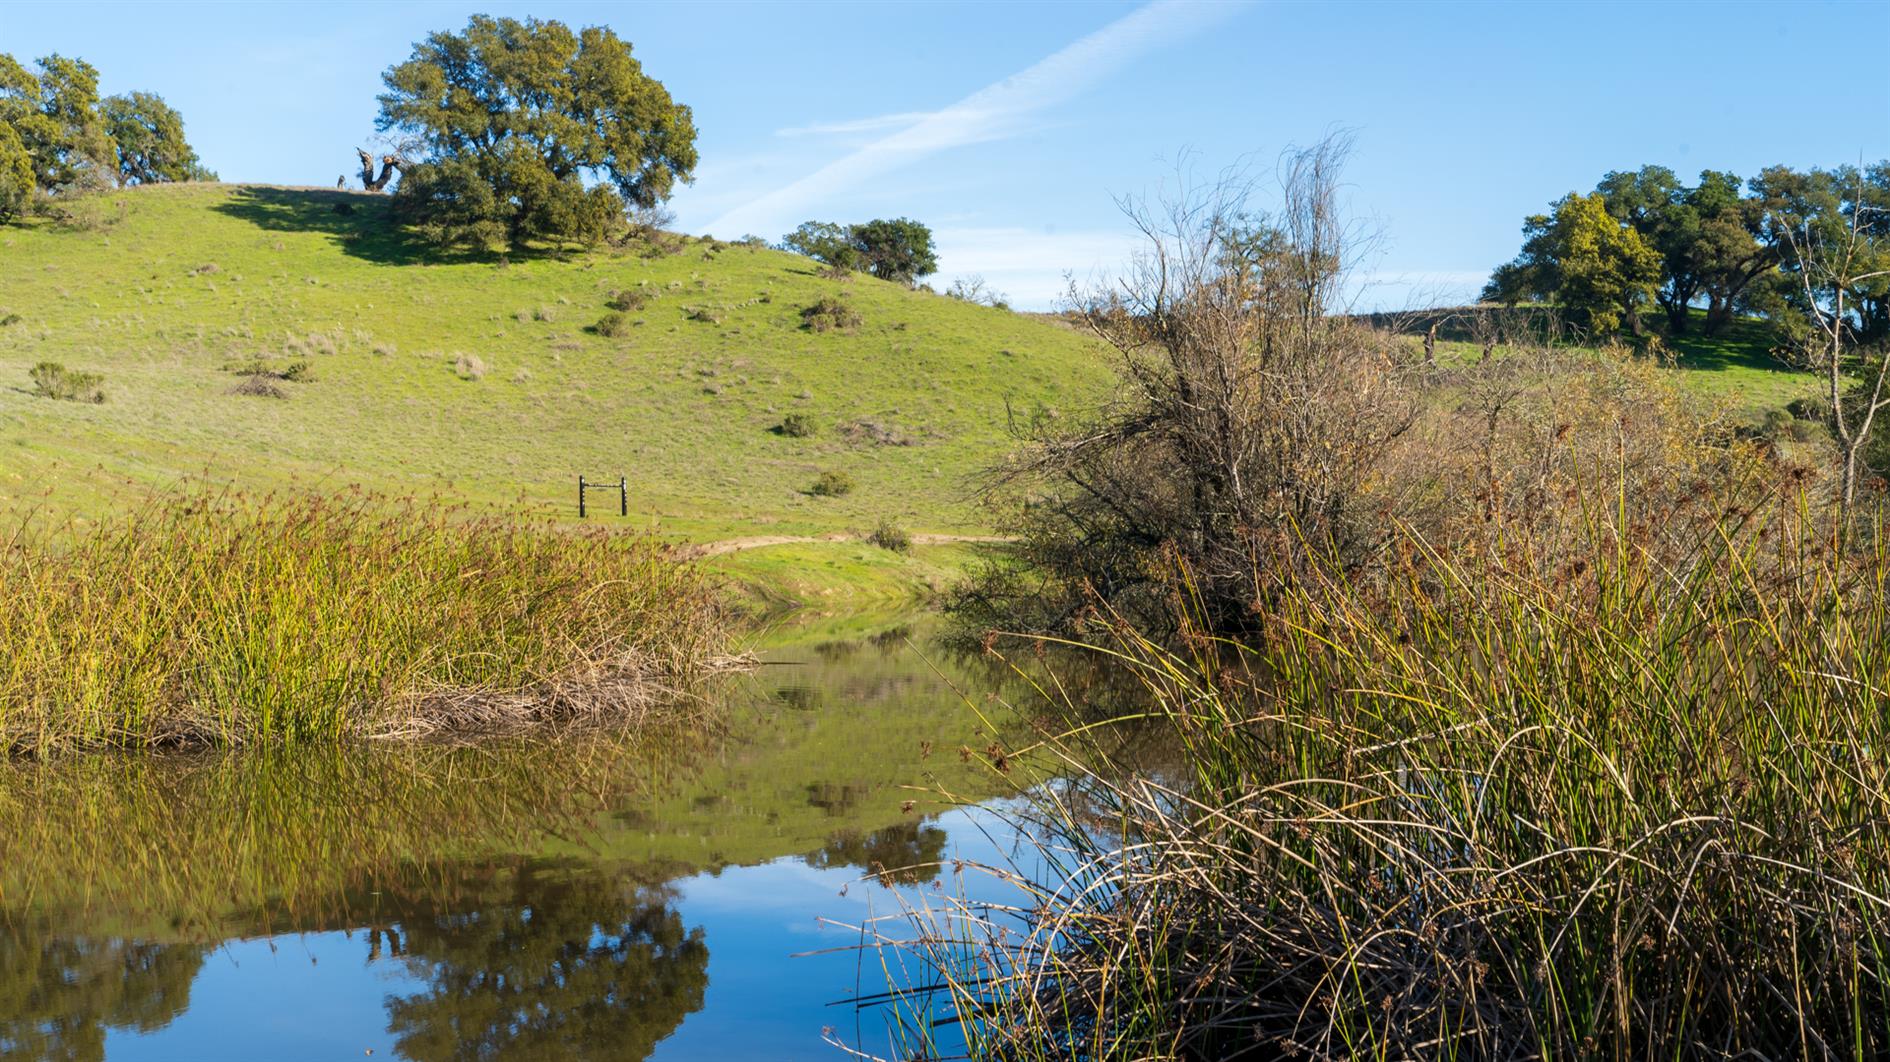
3.8 mile loop with 600 foot elevation gain in Shiloh Ranch Regional Park near Santa Rosa in Sonoma County.
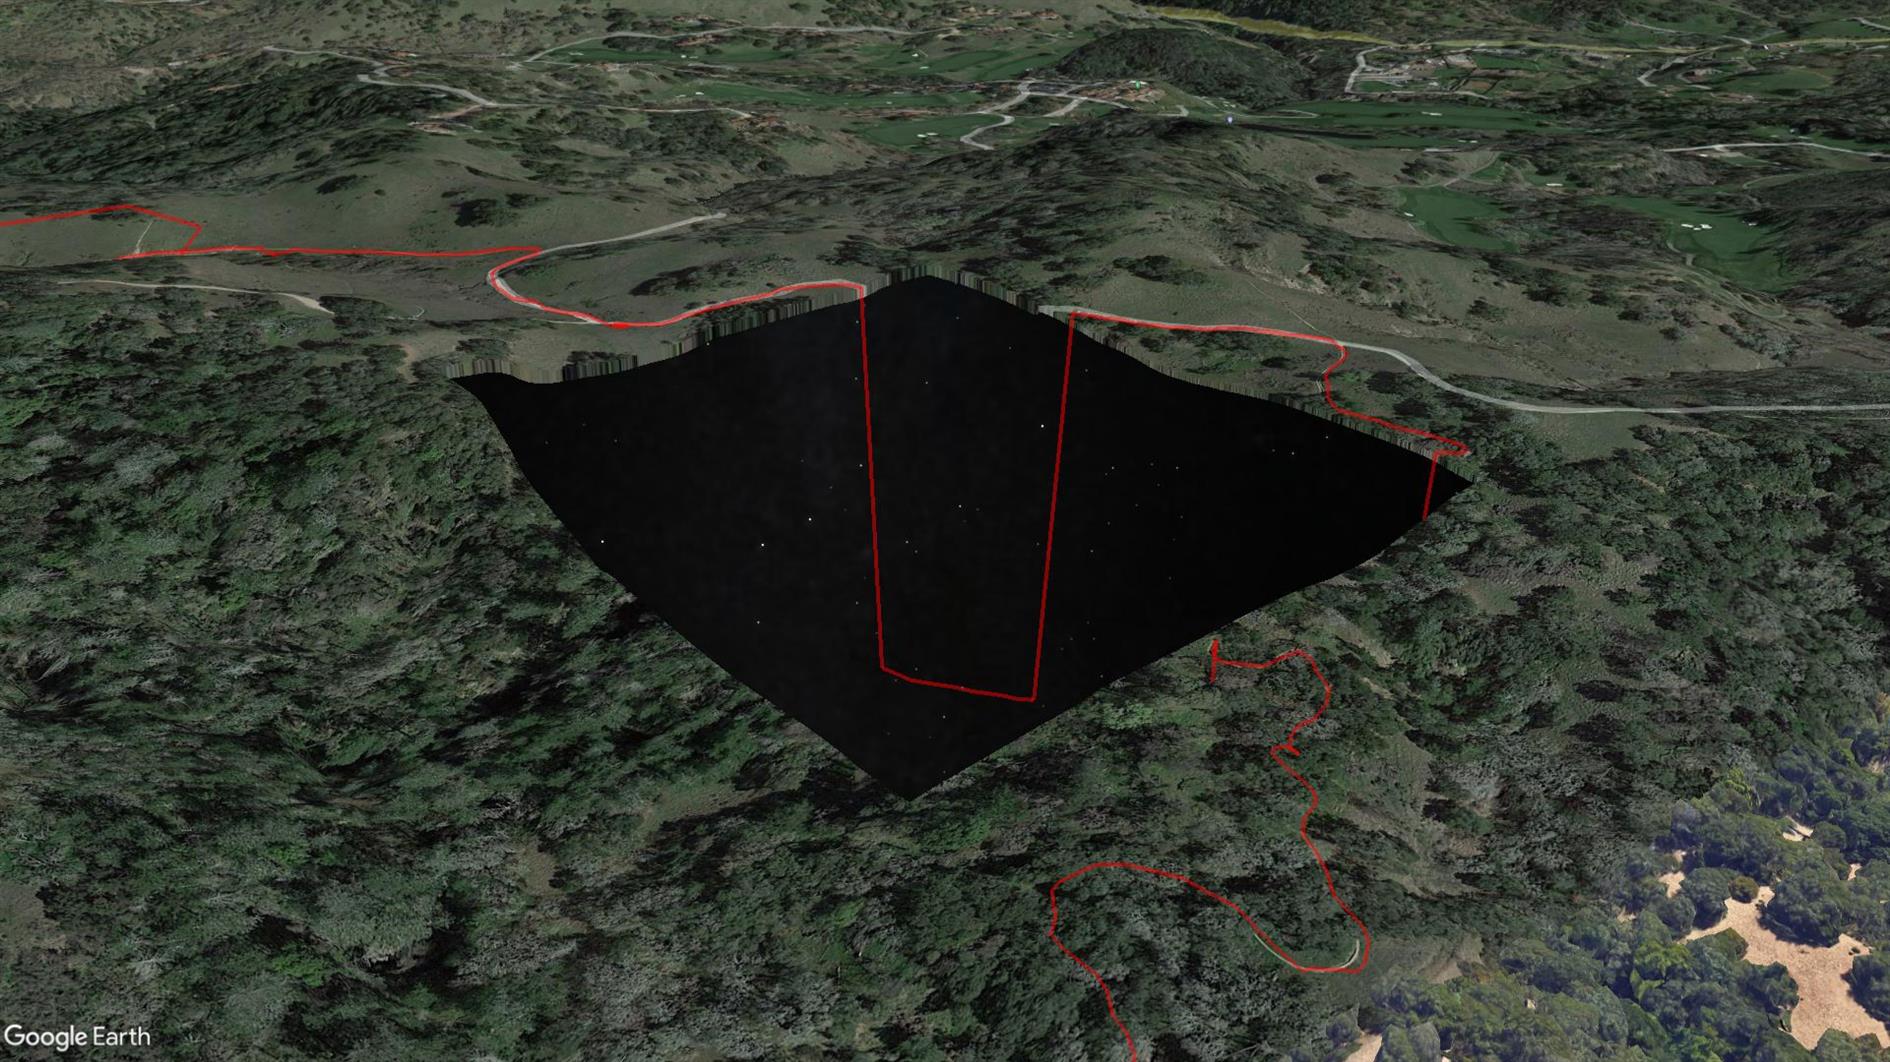
This is the first time my Pixel 4 XL GPS has failed me. Sometimes it wanders a little off trail, but this time it took a completely unauthorized trip to a Home Depot before eventually snapping back to reality. I've included it here but unlike any other track I've uploaded you might not want to use this one (see the route on AllTrails instead, distance incorrect below). The really strange thing is that when I look at the trail in Google Earth there is a missing tile around where the GPS freaks out and Google Earth sends the route plunging down into outer space (because it's clamping to its elevation model but the stars under Sonoma are not as far away as they look?) See the screenshot above. Something is odd at Shiloh Ranch...
(Published to the Fediverse as:
Creekside Trail to Big Leaf Trail Loop #hike#hikevid#map#video 3.8 mile loop in Shiloh Ranch Regional Park, Sonoma, California. This hike includes a GPS failure and a suspicious missing tile in Google Maps that shows the stars below Sonoma.)
By Robert Ellison. Updated on Monday, September 29, 2025.
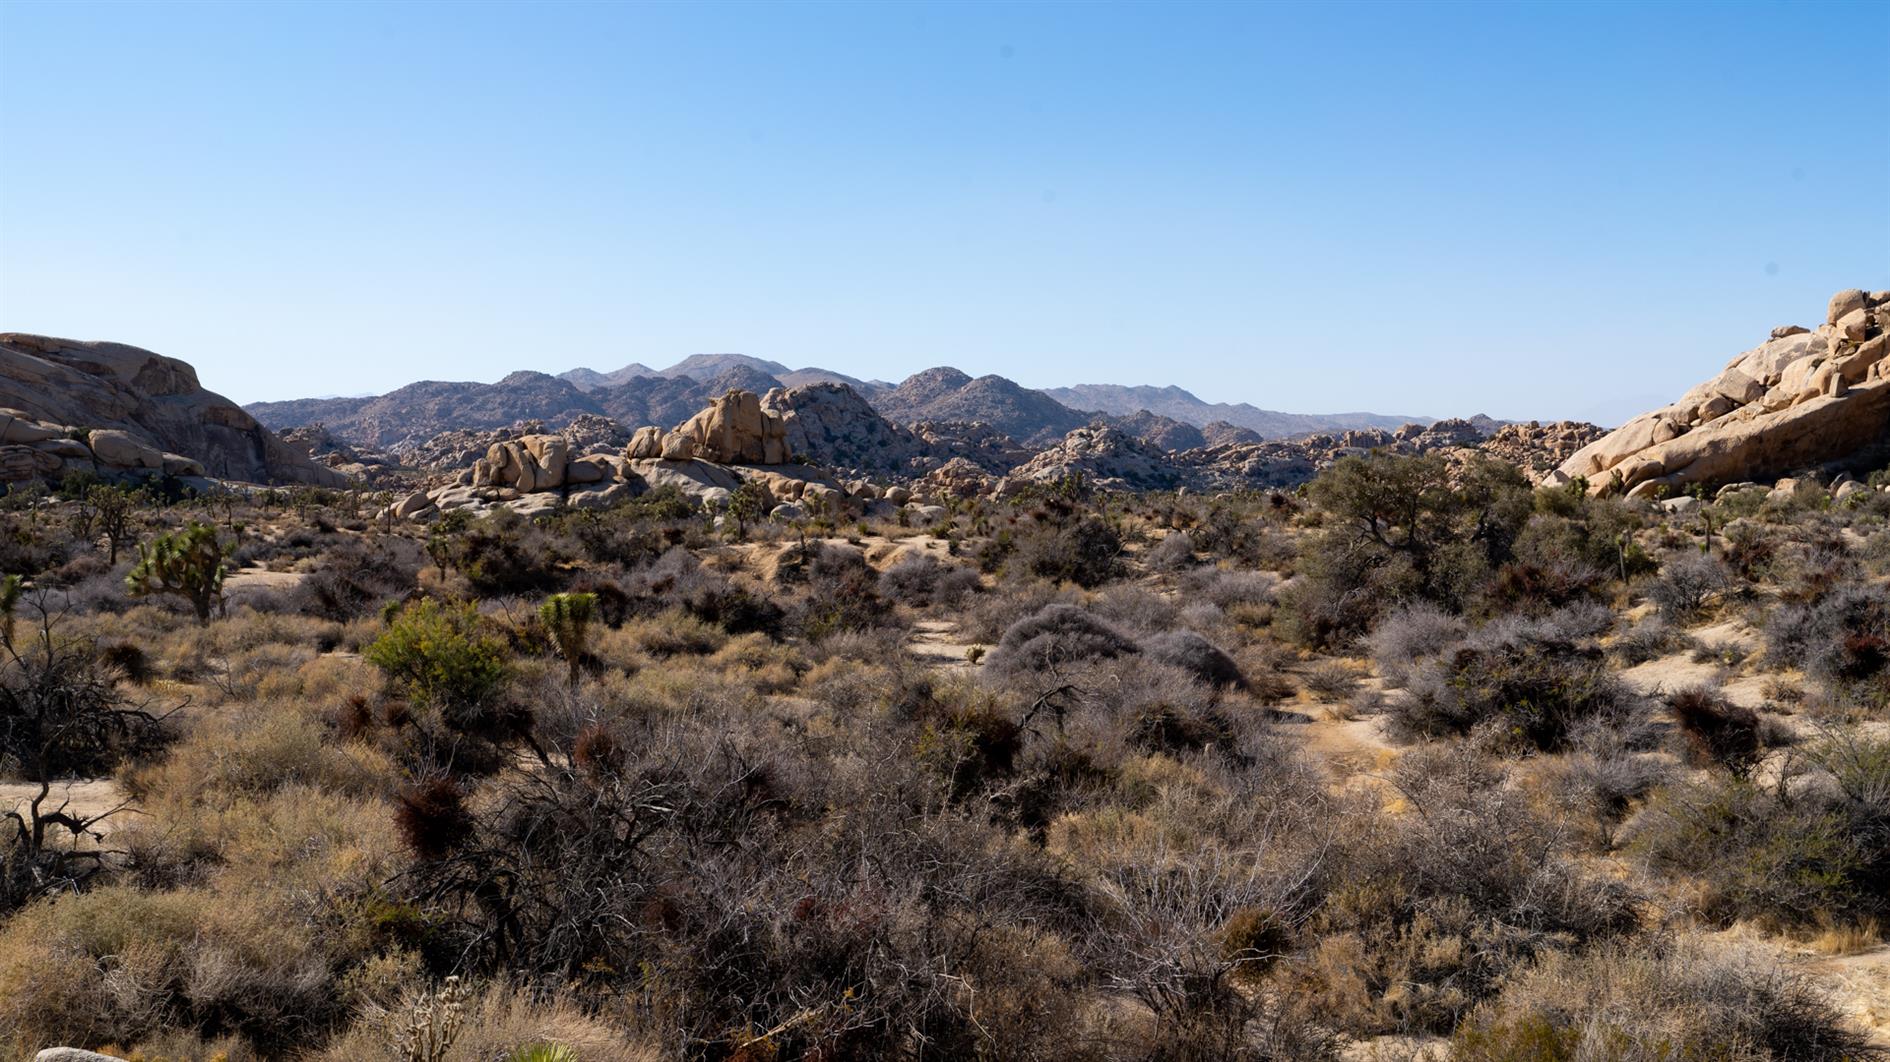
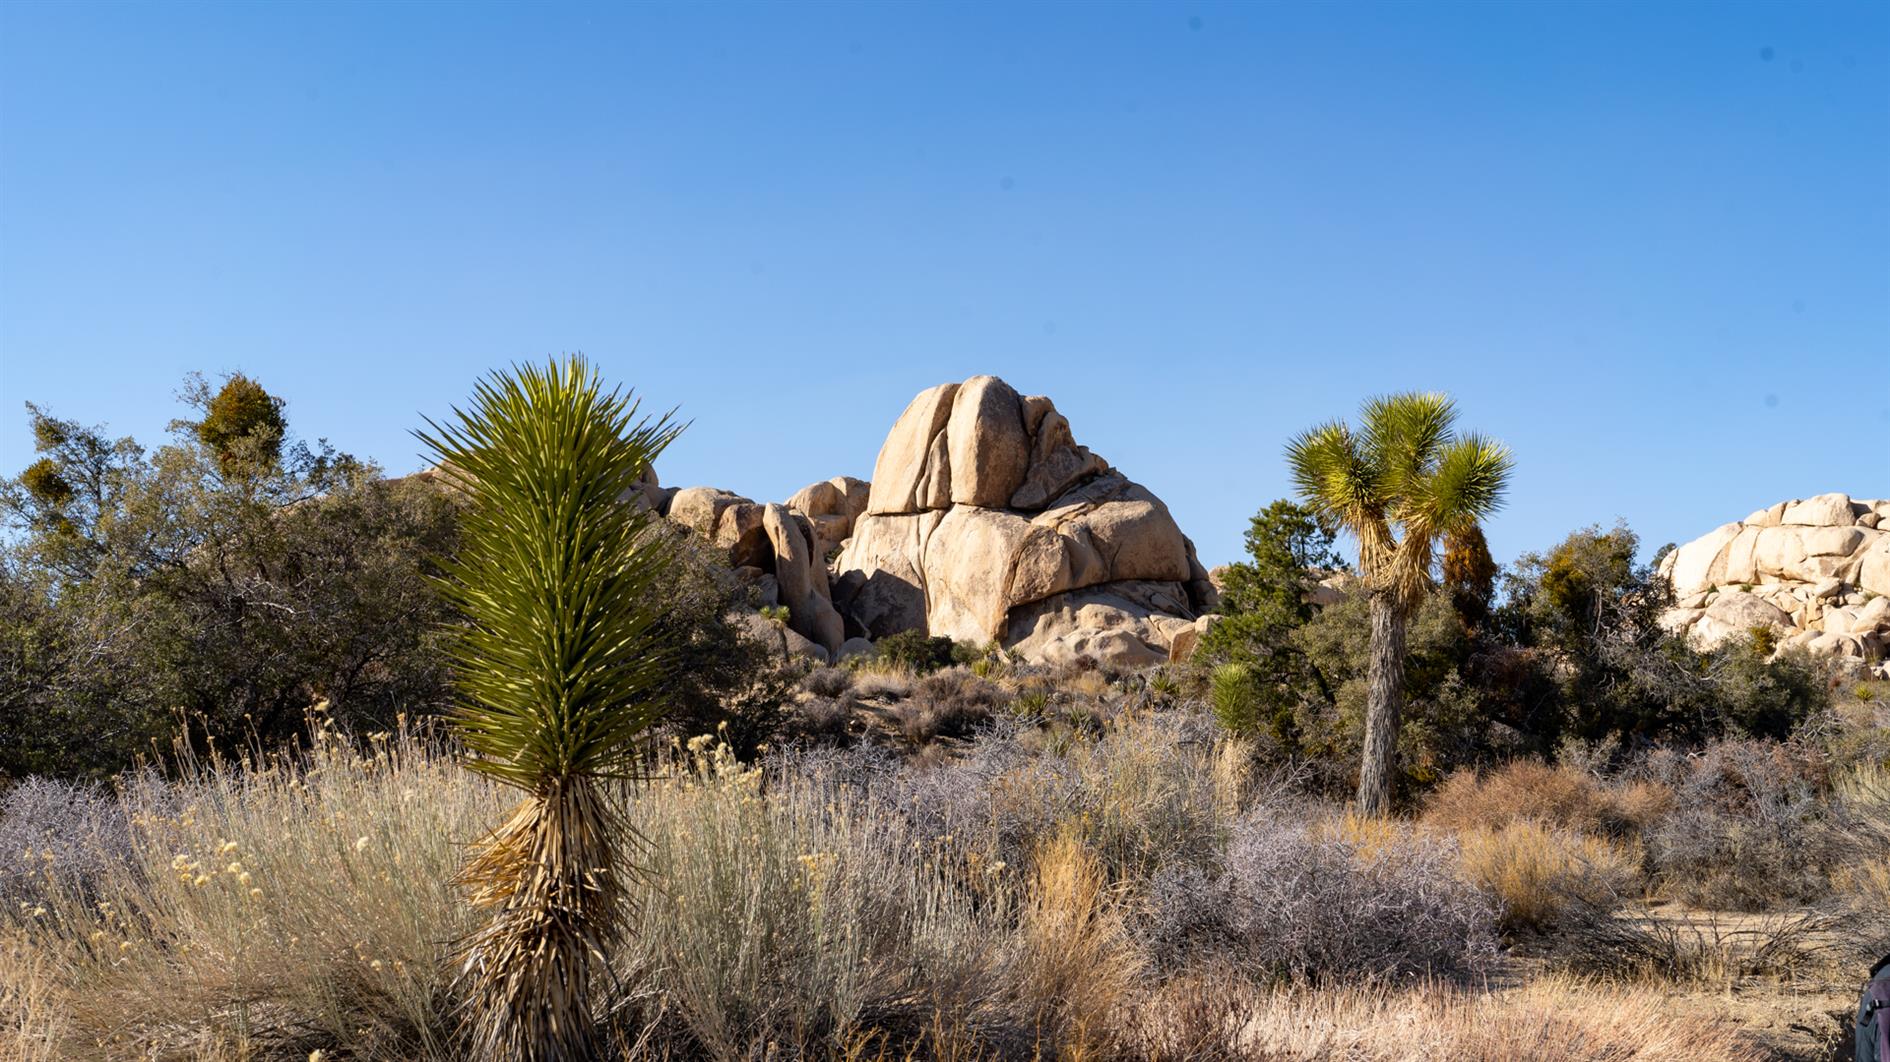
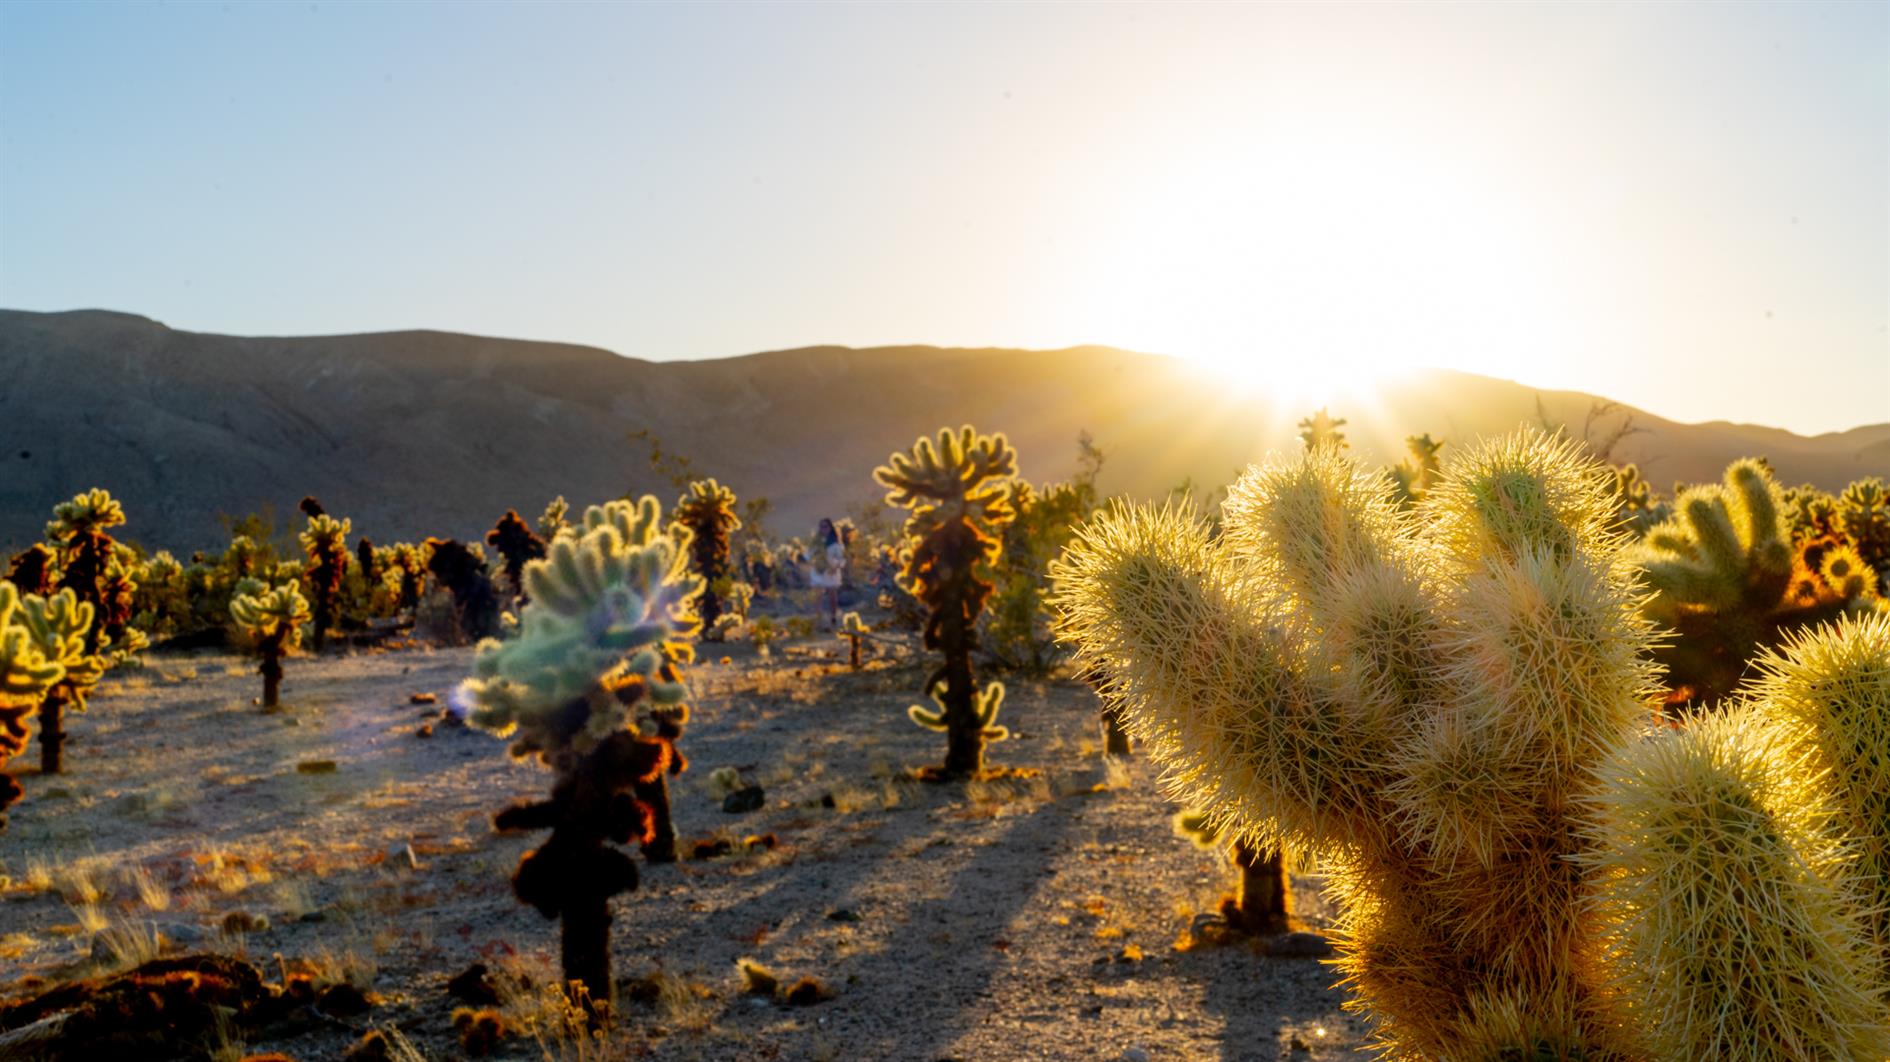
Double feature in Joshua Tree National Park. Barker Dam is just over a mile, a short loop that takes in rock art, the dam, and a nice mix of boulders and desert. Wall Street Mill is two miles out and back and the mill extracted gold to send to the US Mint in San Francisco.
(Published to the Fediverse as:
Barker Dam and Wall Street Mill #hike#map#joshua wo hikes from the same parking lot in Joshua Tree National Park, a one mile loop (Barker Dam) and a two mile out and back (Wall Street Mill).)
By Robert Ellison. Updated on Monday, September 29, 2025.
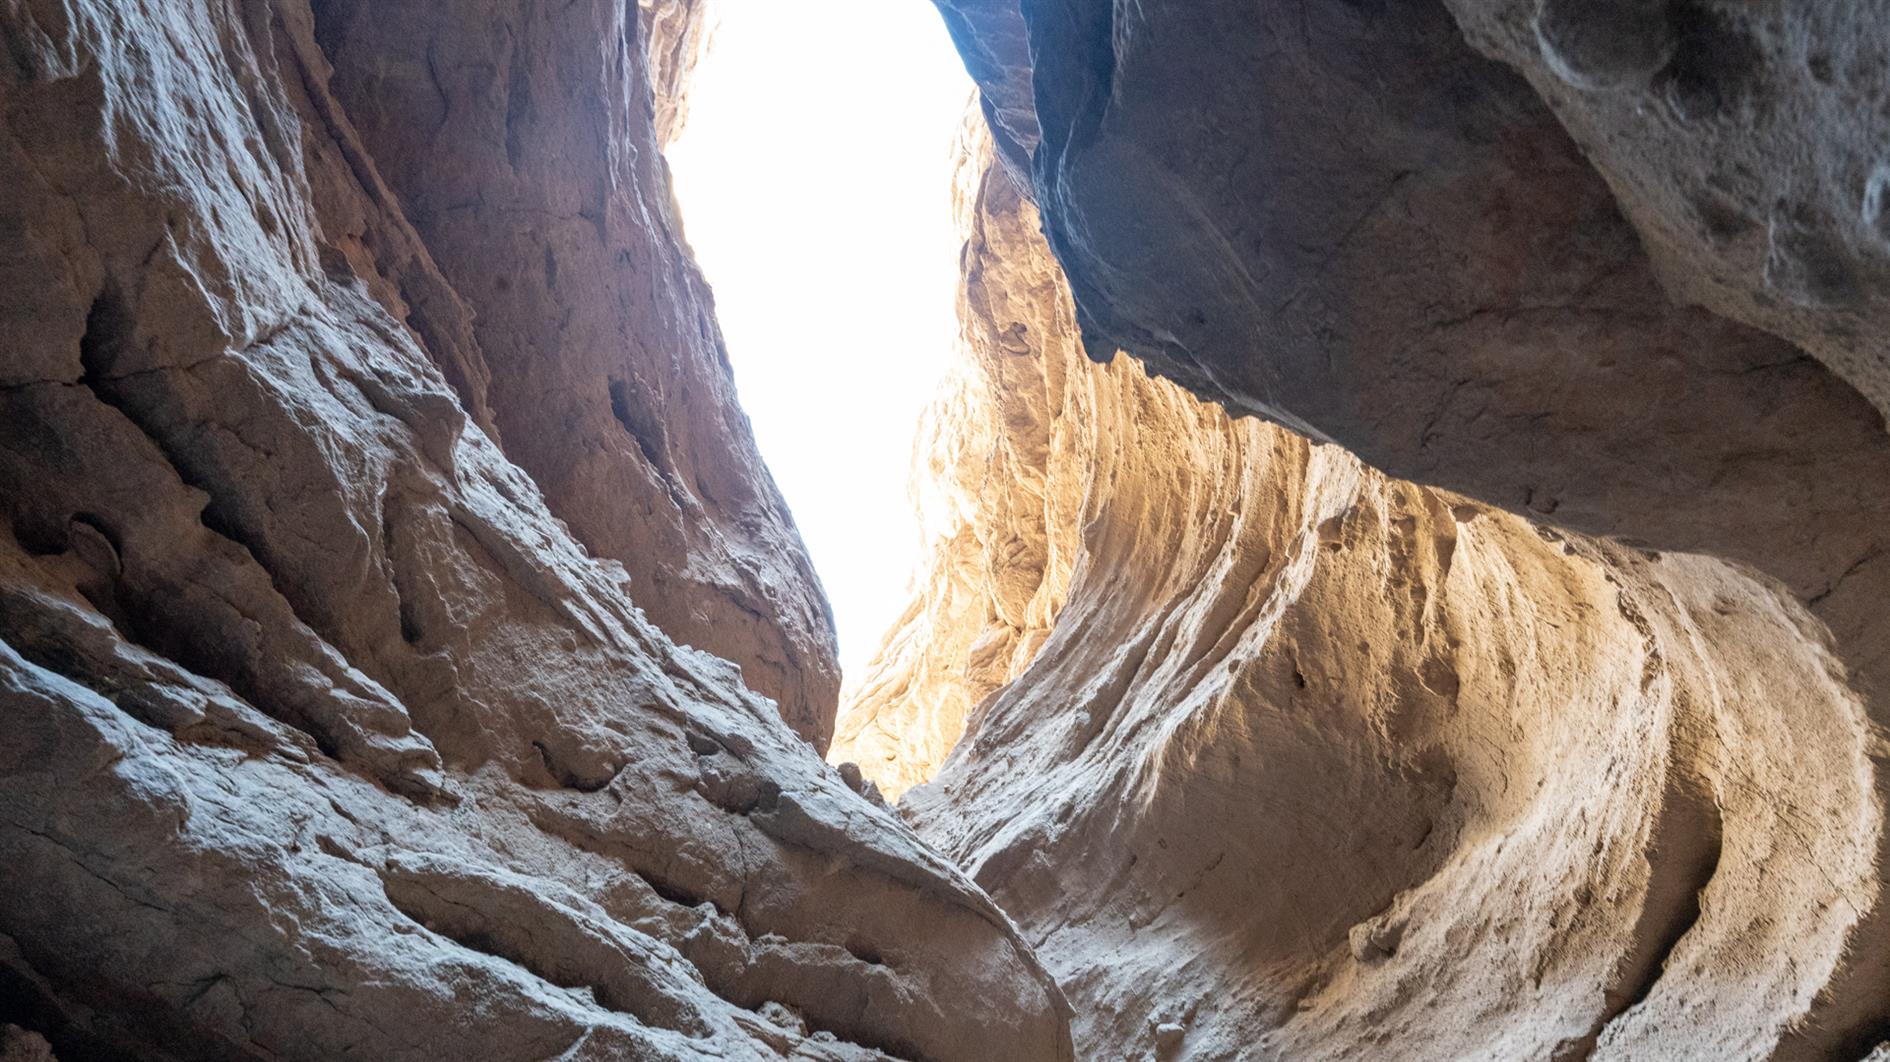
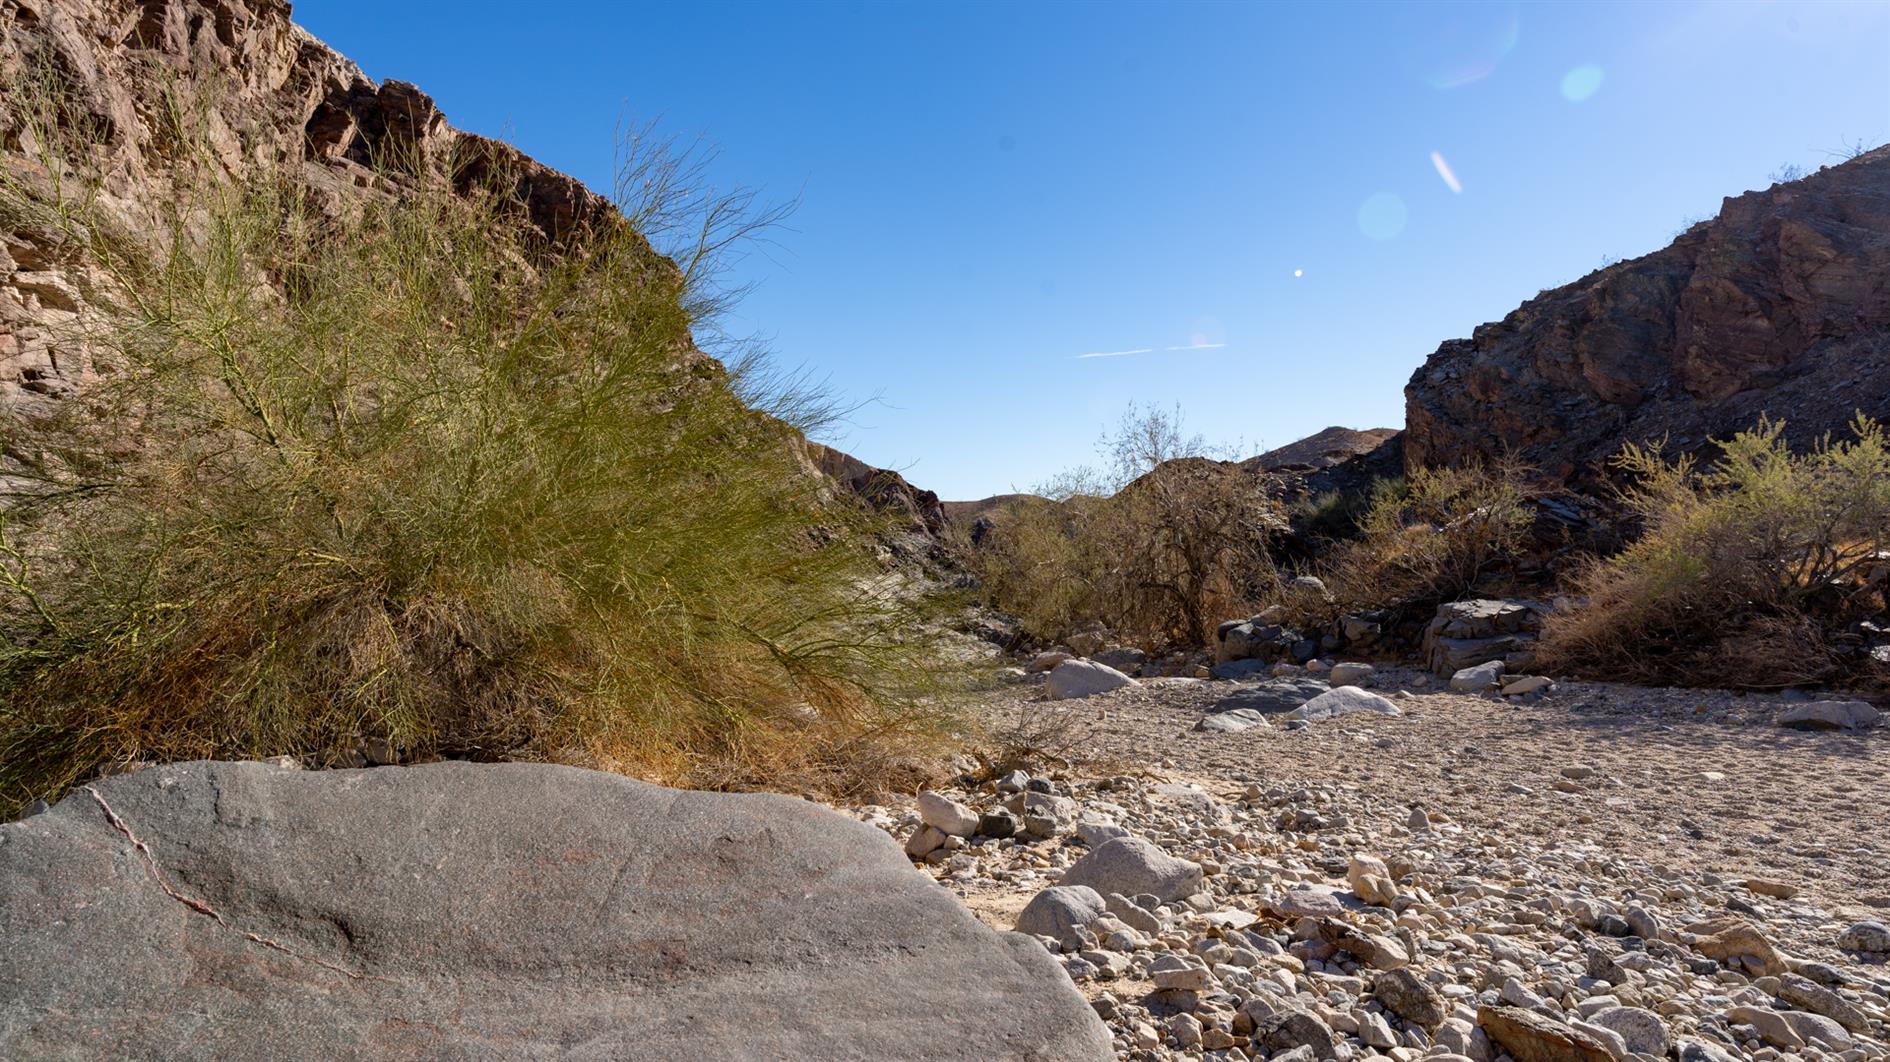
Amazing 4.5 mile hike in the Mecca Hills Wilderness in Riverside County, California. You ascend a slot canyon with ladders of various difficulty helping you up and down along the way. There is a sunny section on a ridge at the top with views back to the Salton Sea and then you return along the wash at the bottom of Painted Canyon. A must do hike if you can handle a few ladders and are in the area.
(Published to the Fediverse as:
Ladder Canyon and Painted Canyon #hike#ladders#canyon#map 4.5 mile loop hike that includes ladders and canyons in Riverside County, California.)
By Robert Ellison. Updated on Saturday, February 19, 2022.
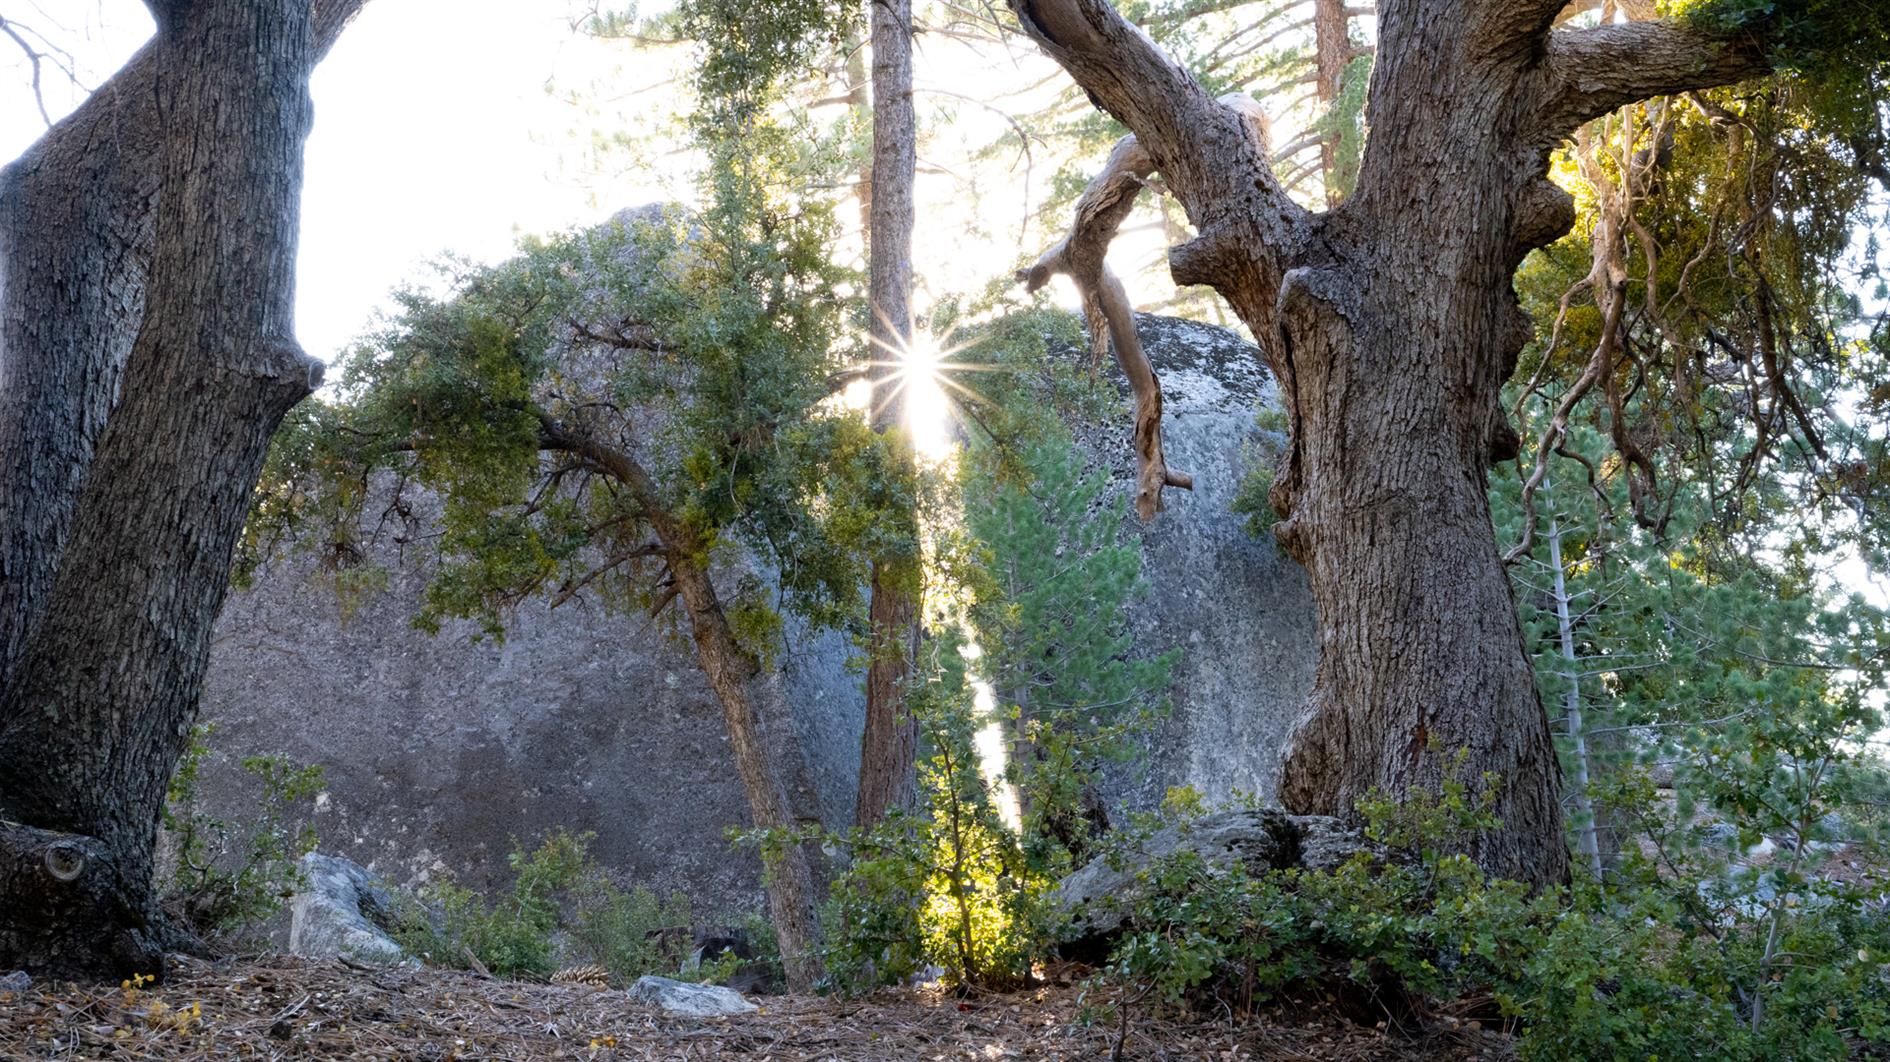
Four and a half mile hike from Stone Creek Campground in Mount San Jacinto State Park to the ruins of a sawmill and back again. The mill is hidden but watch out for a yellow sign off the trail.
The campground was closed for the season when we arrived and a permit is required. We phoned the ranger station who said the trail was off limits and to come get a permit and discuss other hikes. After much discussion it turned out the concern was illegal parking near the campground and after promising to find legal parking and walk in we were allowed to complete the hike.
I don't have a GPS track for this one. Usually I download a GPX to Gaia GPS on my phone and use this to follow the trail. Traveling without a laptop I tried to do this from the AllTrails mobile app which wanted a paid upgrade. I have used AllTrails a fair bit so was happy to pay, but even after upgrading you can only download locally to AllTrails, the mobile app won't allow you to generate a GPX. I understand the commercial desire to lock people into their app, but I have used Gaia GPS for years an trust it to not drain my battery or otherwise cause problems when off the beaten track. AllTrails also won't let you copy and paste from hike descriptions (even ones with a long URL to check for road closures in them), and you can't export the route you took either (which I do from Gaia GPS to generate maps and elevation profiles for this blog). So I'll be cancelling that AllTrails subscription and have learned to get an export from a laptop and ignore the mobile app.
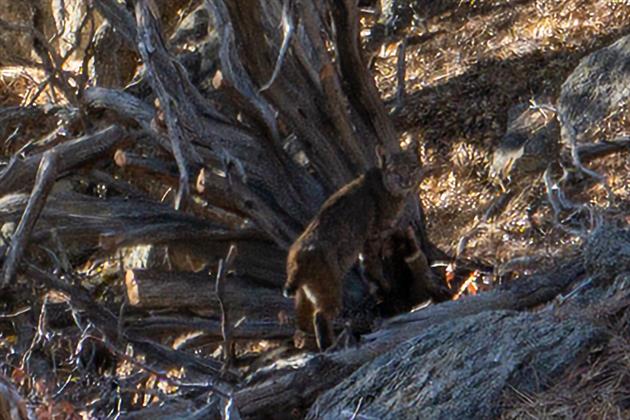
Saw a bobcat which is a first. Probably due to the trail being closed and quiet.
(Published to the Fediverse as:
Sawmill Flats #hike#bobcat#jacinto#video Four and a half mile out and back hike to the ruins of a sawmill in Mount San Jacinto State Park near Idyllwild, California. Starts at 6,000 feet with around 800 gain. Trailhead at Stone Creek Campground.)
By Robert Ellison. Updated on Saturday, February 12, 2022.
San Francisco is apparently going to hell with criminals free to do as they please with no fear of consequences. I decided to take a look at the data.
The video above shows a timelapse of SFPD incidents from 2003 through yesterday. Each frame is a day and shows incidents from the previous seven days. The top left corner of the video shows the date and the seven day count of incidents.
I grouped the reported categories into a few colors. Red is used for murder and rape. Orange for arson and kidnapping. Yellow for thefts and assaults. Purple for sex and drugs. Grey for anything else. I excluded some categories from the data (recovered vehicle, traffic collision, case closure and non-criminal).
SFPD reports the location of incidents as the closest intersection. To keep everything visible I move the location randomly within a tenth of a mile where there is a specific location reported. For crimes without a location I use a random spot within half a mile of the center of the police district (or the center of San Francisco if the district is missing - this is unusual).
The volume of incidents changes a bit during the ~18 years shown in the video, but the only real outlier is the dip following the start of the coronavirus pandemic in March 2000. Crime picks back up after this but so far hasn't returned to the level it was at before the pandemic.
(Published to the Fediverse as:
San Francisco Crime 2003 to 2021 #timelapse#sanfrancisco#crime#datalapse#coronavirus#video Timelapse video animation showing crimes in San Francisco color coded by category from 2003 to 2021 using SFPD incident reports from SFData.gov.)
By Robert Ellison. Updated on Saturday, December 4, 2021.
I'm lucky enough to have the right sort of TPM so Windows 11 installed smoothly on my laptop through Windows Update. It's got some nice fit and finish improvements and round corners and generally seems well put together. Except for anything I actually use and care about on a regular basis.
It is still impossible to get rid of notifications with one click. This has actually regressed from Windows 10 as we're back to a little x to dismiss which actually sends the notification off to the action center for when you have some spare time to dismiss it a second time. Microsoft, spend less time on focus assist and more time on this!
The taskbar wants your icons in the center. If I wanted a Mac I would have bought one. Luckily there is a setting to move them back to the left. But one thing you can't do is have small taskbar icons. There is a registry hack, but it breaks the system icons so until that's fixed the main impact of Windows 11 for me is missing out on about one row of a spreadsheet. I would like those pixels back!
Maybe the start menu is better, but I stopped using that with Windows 10 and now just pin apps or search for them so I'd never know.
A few weeks into my Windows 11 adventure and I think they handed this one off to the designers and forgot the adult supervision.
Alt-Tab you have one job and it's switching between applications. Why then is the selection now indicated by a hair thin black border? It's pretty, but I now have to squint to figure out where I'm going.
Worse still you can no longer drag and drop to the taskbar. I don't do this every day, but it's a big time saver when I need it. Now I have to go through a re-org of windows to drag things between them.
(Published to the Fediverse as:
Windows 11 Broken Notifications #etc#windows#microsoft Windows 11 still won't let you dismiss notification with one click. It also gets rid of small taskbar icons. The windows have nice rounded corners though!)