(Published to the Fediverse as:
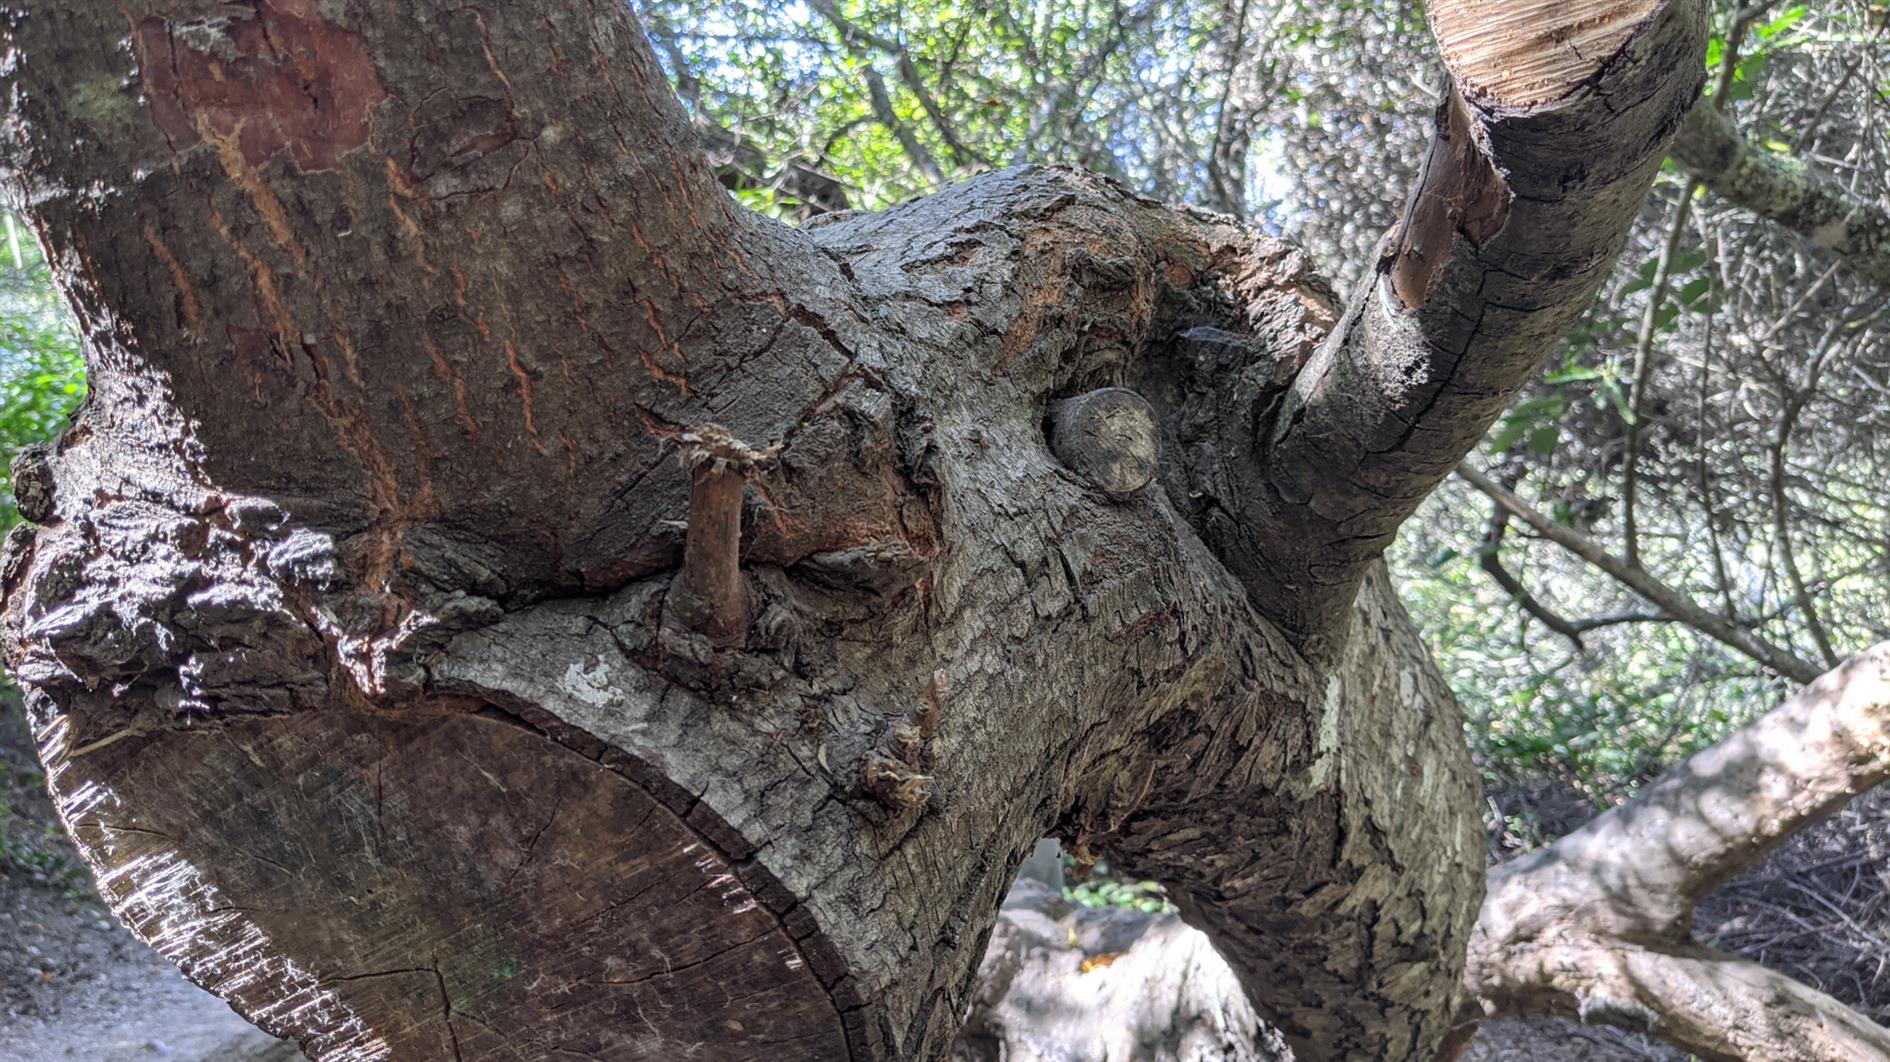
Stumpoceros #photo#tree Photo of a tree branch that looks like some sort of rhinoceros in Glen Canyon Park, San Francisco, California.)
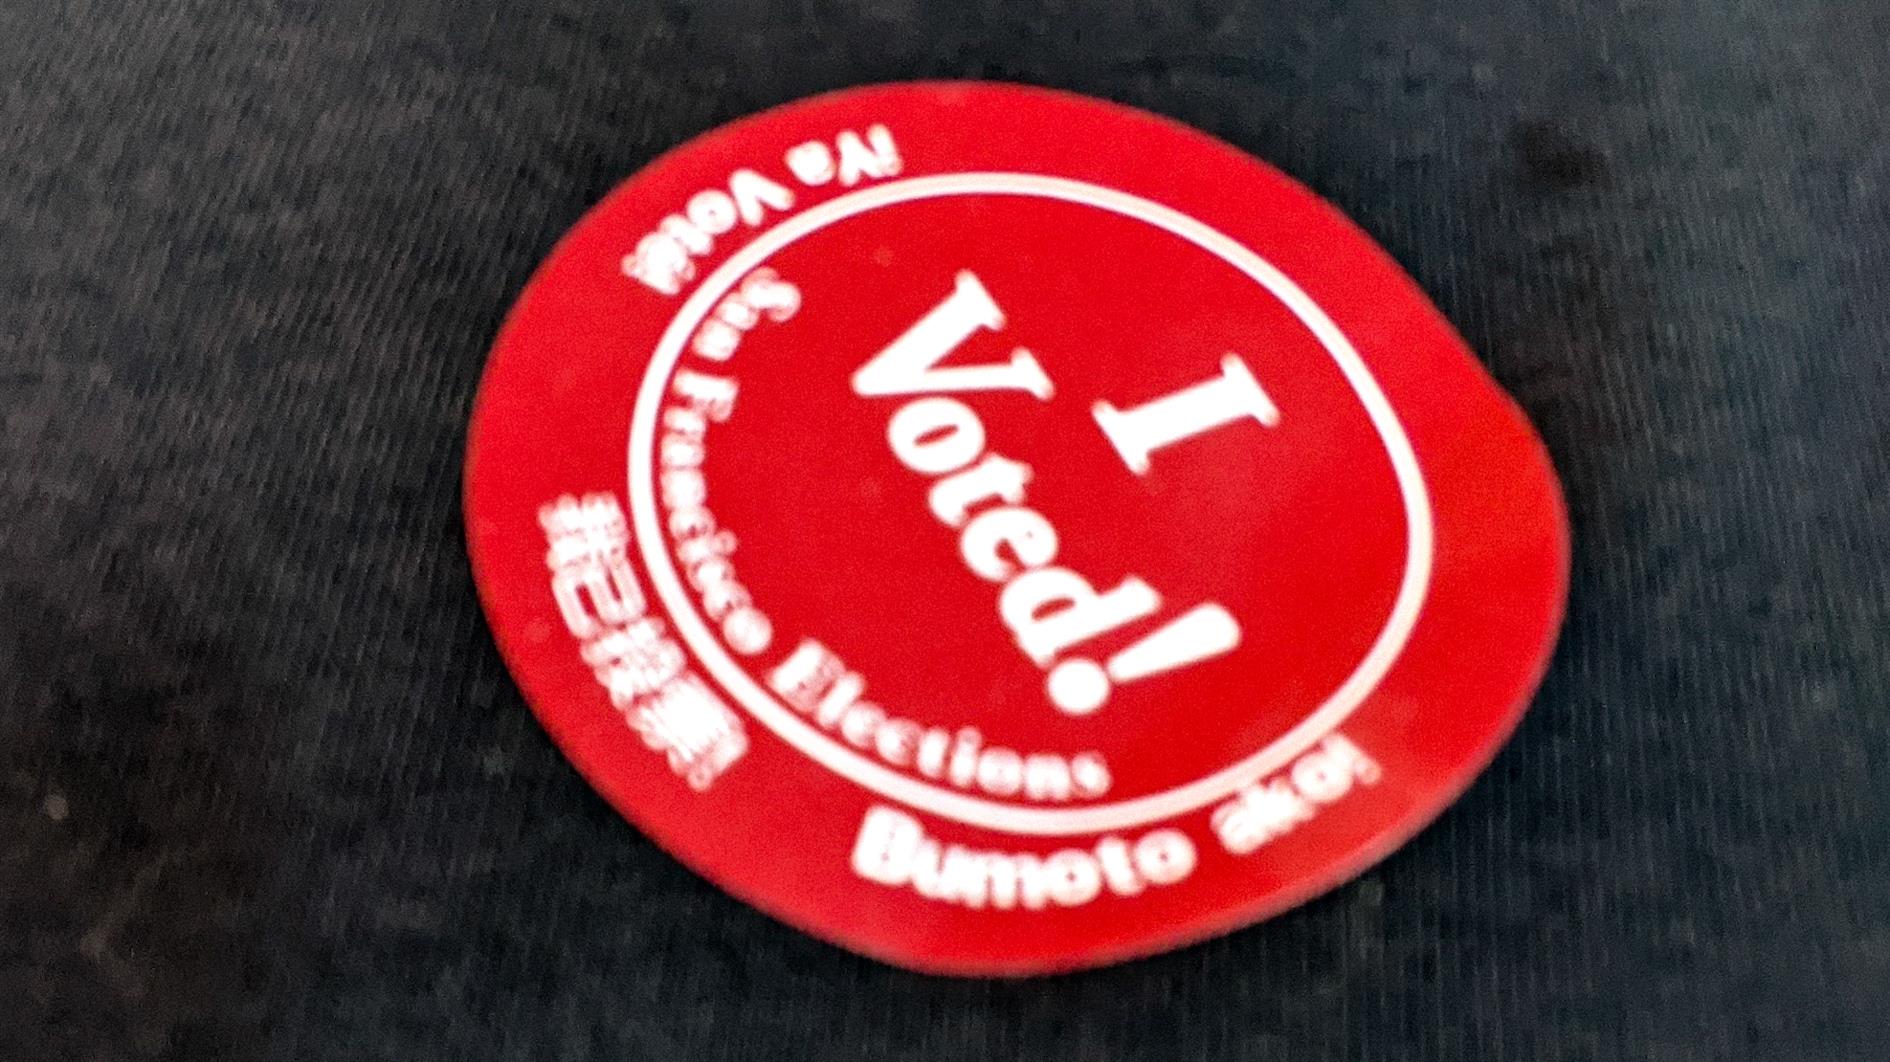
This is the first time I have voted by mail. In San Francisco there are clear instructions, a postage paid reply envelope and no need to get your ballot notarized or witnessed or other painful admin. The only real dilemma is the I Voted! sticker. When voting in person you just slap it on and wear it for the rest of the day. But when is the appropriate time for a postal vote? The instructions say:
"Show other San Franciscans you've voted to help encourage them to vote too!"
I get that, but it doesn't really speak to timing.
Is it a November 3rd thing to help with a final turnout push? When you actually fill it out? When you get round to dropping it in a mailbox?
Actually it's even more complex because there is a fancy ballot tracking system. So I get SMS notifications for when USPS has picked up the ballot, when San Francisco County has received it and finally when the ballot is accepted.
(Published to the Fediverse as:
I Voted! #politics#sanfrancisco#election If you vote by mail you still get an I Voted sticker but the etiquette on when to wear it is far from clear.)
By Robert Ellison. Updated on Monday, September 29, 2025.
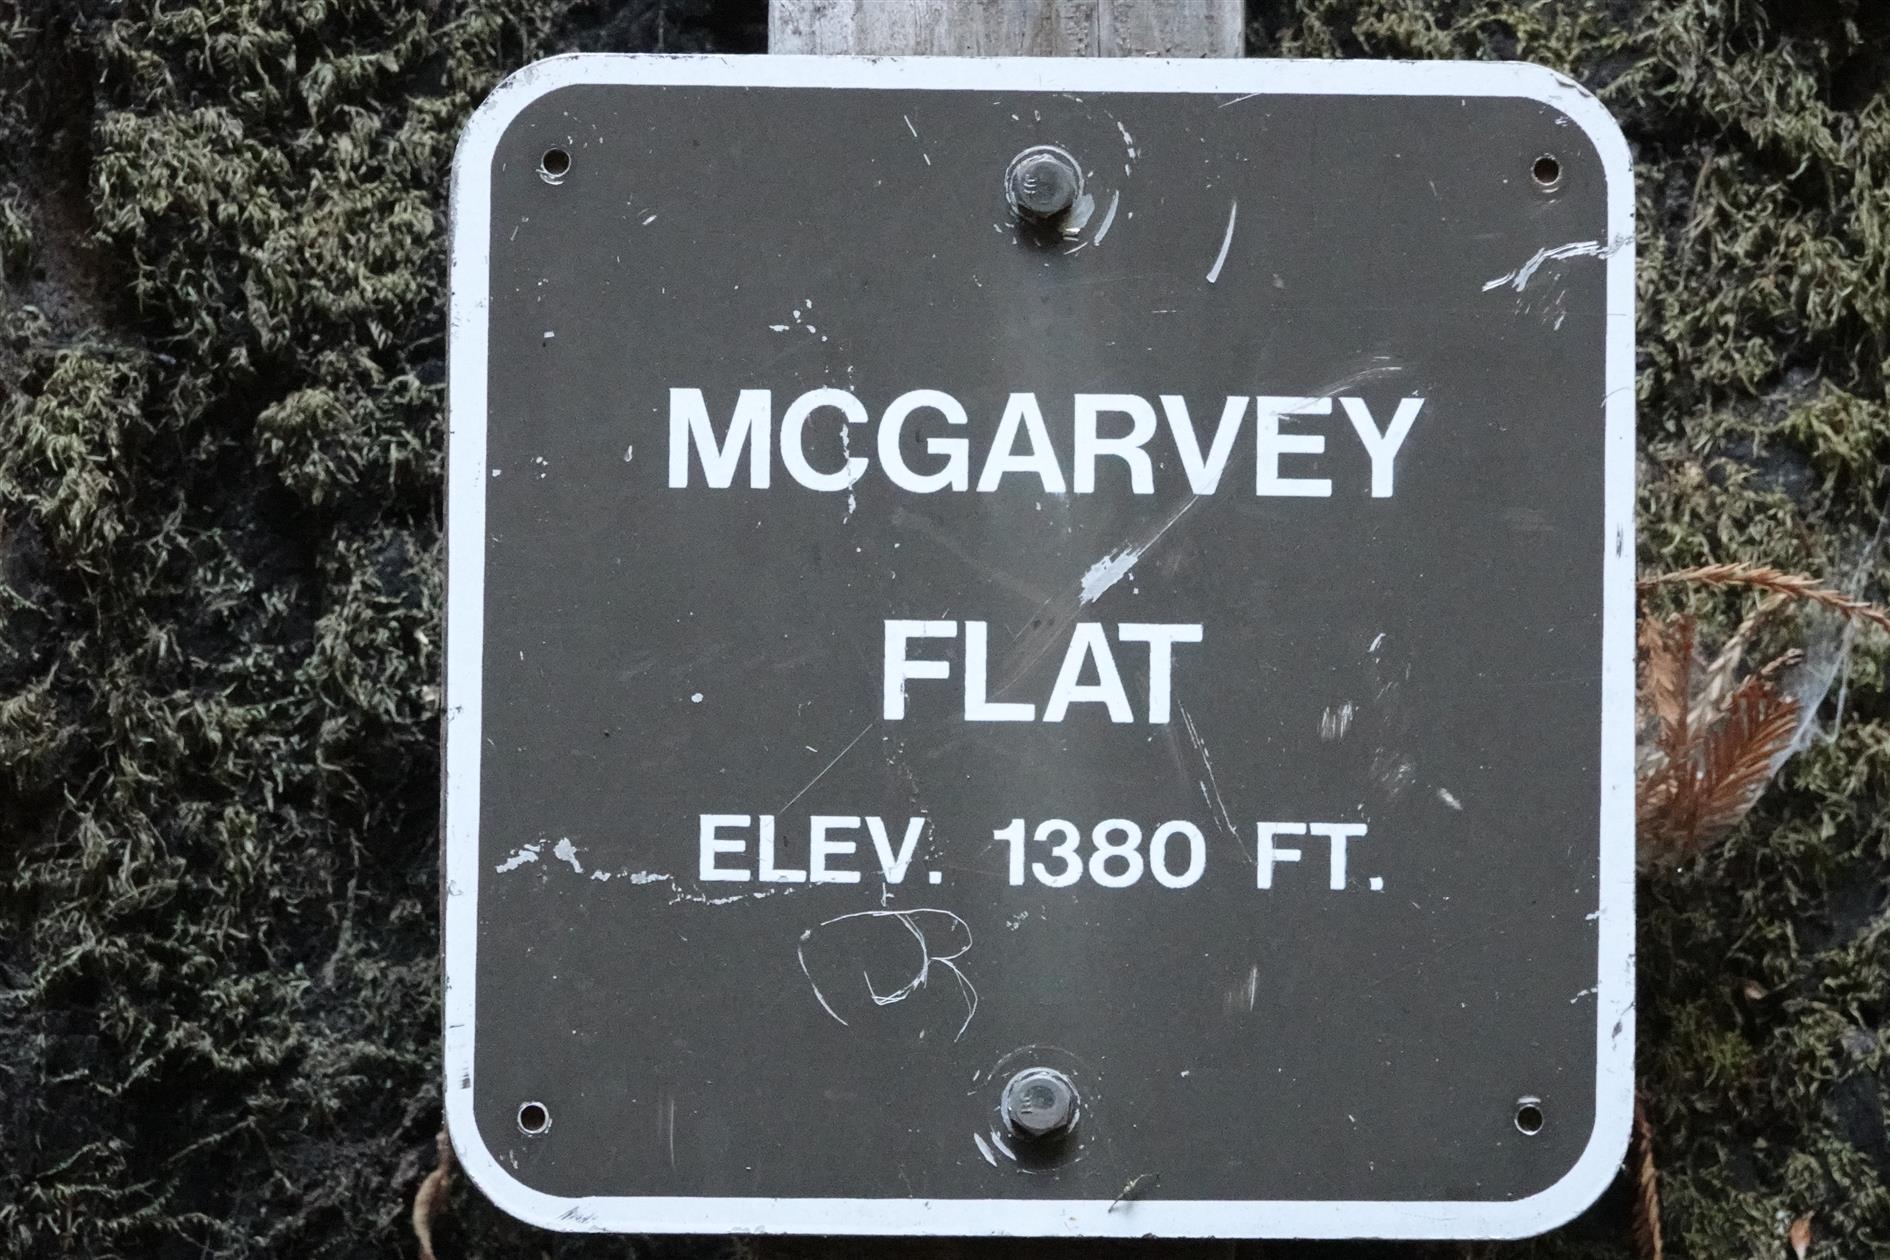
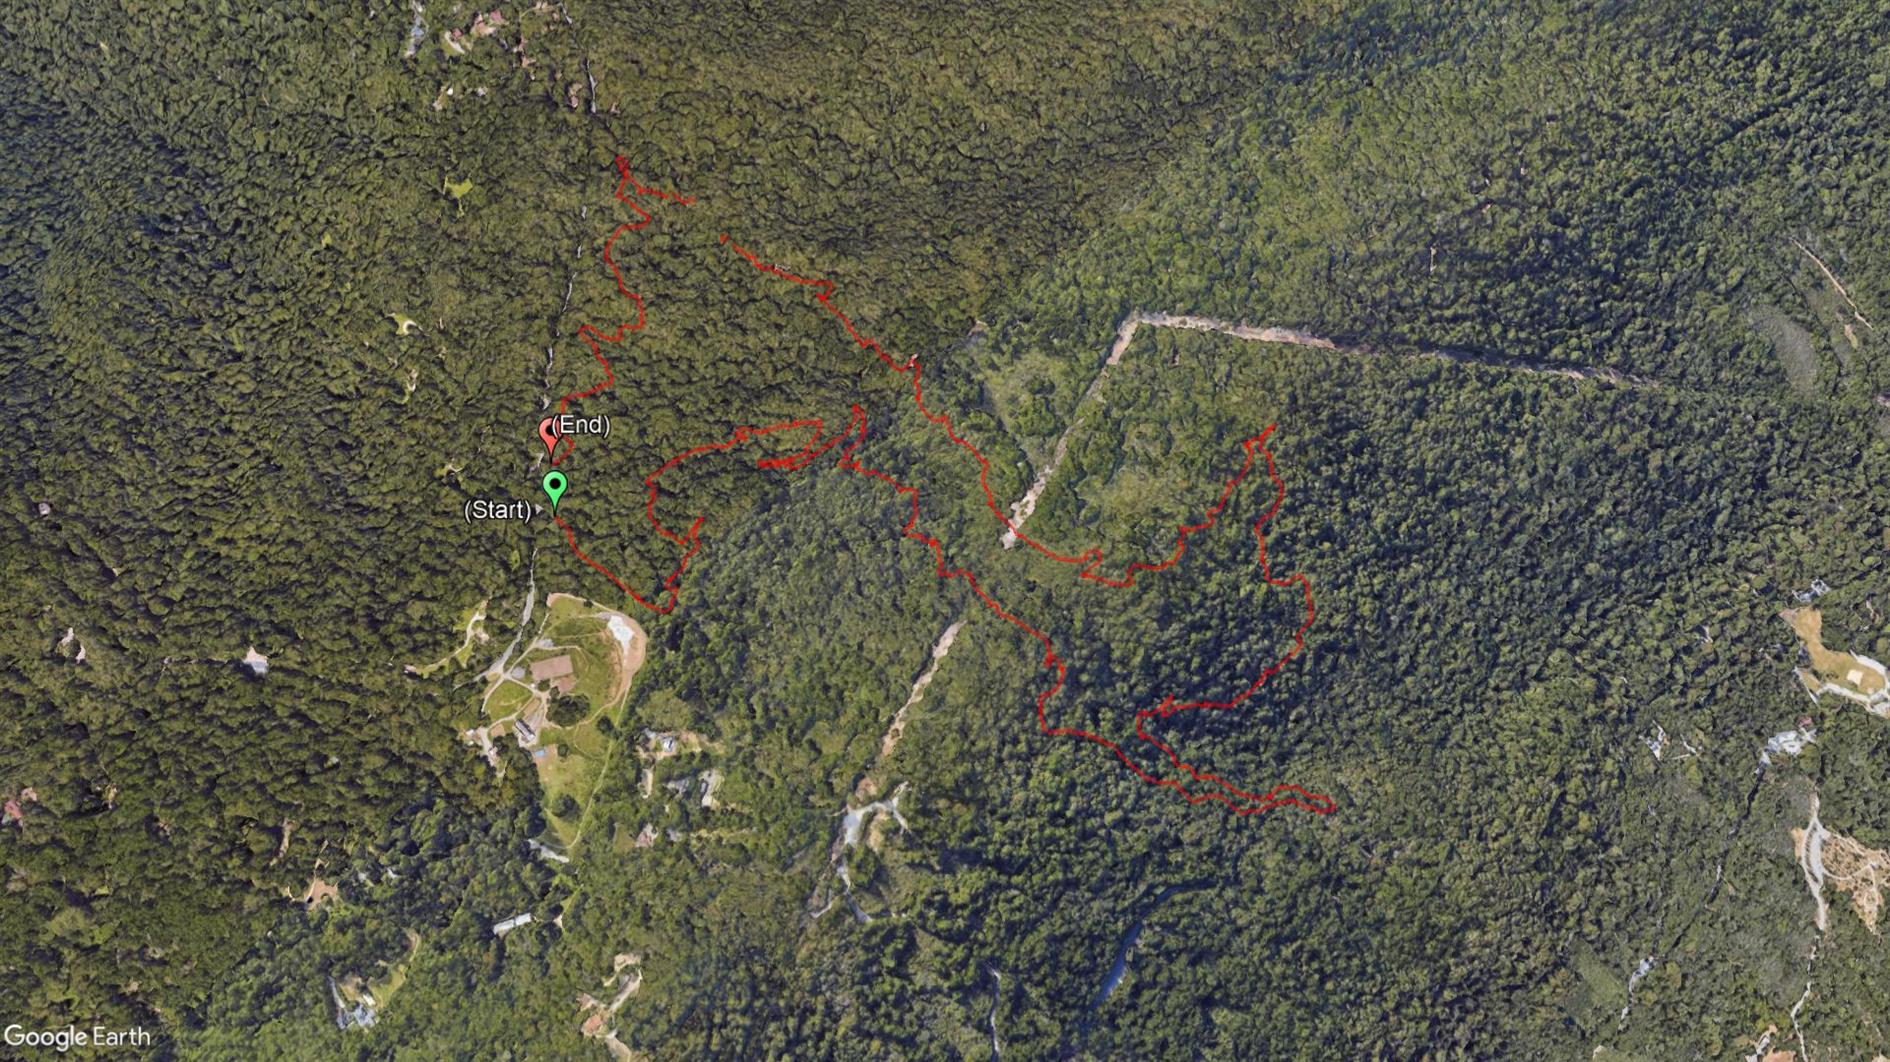
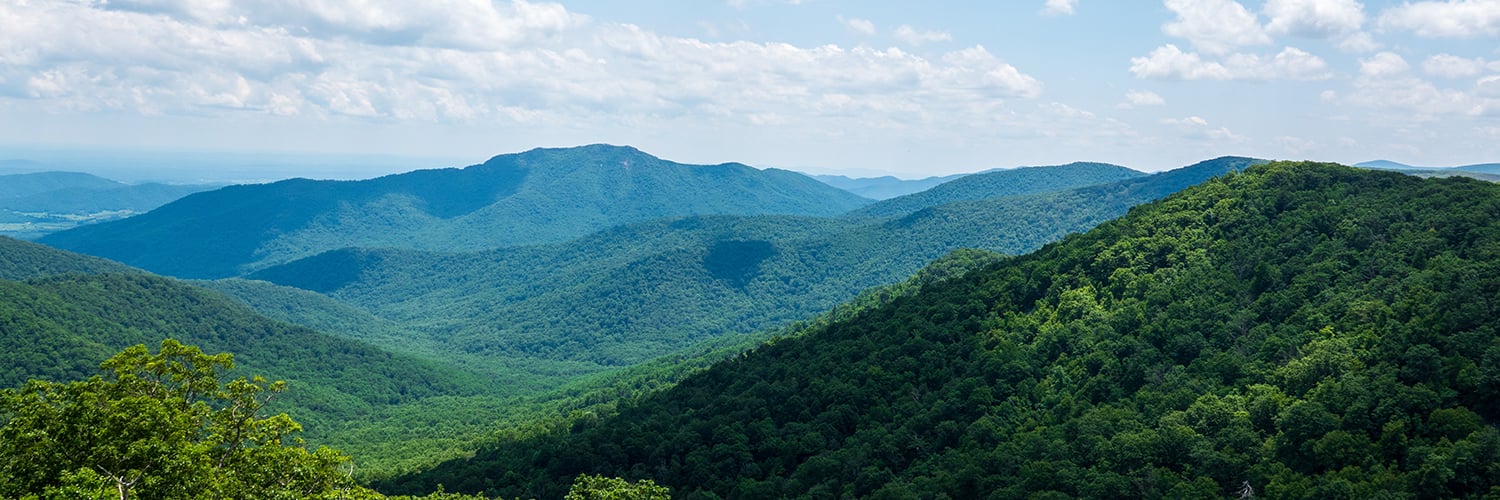
A 4 mile loop starting at Skyline Boulevard and descending through dense forest from 2,000 feet to McGarvey Flat at 1,380 before ascending in slightly brighter but still shaded conditions. Perfect on a warm day. This is in Huddart Park in San Mateo county, just the other side of 35 from Purisima Creek. The hyperlapse video shows the second half of the hike.
By Robert Ellison. Updated on Sunday, September 28, 2025.
A good principle for figuring out propositions is that the more money is being poured into local news ad spots the more that position is likely to be a case of concentrated benefits and diffuse costs with you on the receiving end of the costs. I mostly follow that below.
Also, I've realized that previous proposition links have rotted, because of course the state government is too busy to maintain a permalink and maybe even some history for measures that we now seem to need to vote on every two years. Maybe I need to start a proposition to fix that. Anyway...
No. CIRM doesn't seem to have delivered much since 2004, it's not a good time to add more debt obligations and I feel that we would be better off funding more basic research in universities.
15: INCREASES FUNDING SOURCES FOR PUBLIC SCHOOLS, COMMUNITY COLLEGES, AND LOCAL GOVERNMENT SERVICES BY CHANGING TAX ASSESSMENT OF COMMERCIAL AND INDUSTRIAL PROPERTY.
Yes. Market rate property taxes for >$3M properties to increase school and college funding.
16: ALLOWS DIVERSITY AS A FACTOR IN PUBLIC EMPLOYMENT, EDUCATION, AND CONTRACTING DECISIONS.
No. Employment and education should be color blind. Affirmative action perpetuates racism. I'd rather see measures that increase opportunity rather than provide compensation.
17: RESTORES RIGHT TO VOTE AFTER COMPLETION OF PRISON TERM.
Yes. If you have served your time then you should be participating in society again.
18: AMENDS CALIFORNIA CONSTITUTION TO PERMIT 17-YEAR-OLDS TO VOTE IN PRIMARY AND SPECIAL ELECTIONS IF THEY WILL TURN 18 BY THE NEXT GENERAL ELECTION AND BE OTHERWISE ELIGIBLE TO VOTE.
Yes. And I say this while recommending a no vote on San Francisco's Measure G. This is participating in a primary when you're old enough to vote the general which is different from lowering the voting age overall.
19: CHANGES CERTAIN PROPERTY TAX RULES.
No. When the person playing the firefighter in the constant ads says the puppy just won't make it unless you support the proposition you know it must stink.
20: RESTRICTS PAROLE FOR CERTAIN OFFENSES CURRENTLY CONSIDERED TO BE NON-VIOLENT. AUTHORIZES FELONY SENTENCES FOR CERTAIN OFFENSES CURRENTLY TREATED ONLY AS MISDEMEANORS.
No. Lock more people up for more time? We don't need to be spending more money on prisons. California (and the US generally) needs to be looking to reduce our dependence on locking people up (and get rid of for-profit incarceration).
21: EXPANDS LOCAL GOVERNMENTS' AUTHORITY TO ENACT RENT CONTROL ON RESIDENTIAL PROPERTY.
No. I'm a little torn on this one but we already have a state law controlling rent increases and the fact that Gavin opposes this prop pushes me to a no.
22: EXEMPTS APP-BASED TRANSPORTATION AND DELIVERY COMPANIES FROM PROVIDING EMPLOYEE BENEFITS TO CERTAIN DRIVERS.
No. Otherwise everyone is going to end up being contracted through an app. Maybe that's OK if we manage to fix other problems - universal health care that is unconnected to employment for instance - but right now these employees deserve the protections and rights that go with providing the service.
23: ESTABLISHES STATE REQUIREMENTS FOR KIDNEY DIALYSIS CLINICS. REQUIRES ON-SITE MEDICAL PROFESSIONAL.
No. This is an issue where I hate both sides and also hate voting the same way as the advertising. I support universal single payer healthcare and this is a vote in favor of profit driven dialysis clinics. But it's not clear that they need a doctor on site and the other side is a profit seeking union looking to muscle in. I resent being involved in the decision and default to no.
24: AMENDS CONSUMER PRIVACY LAWS.
No. Not until we get something that might actually work. The result of all of these privacy choice measures is that you just get an ugly banner on every website that gives you the 'choice' between continuing to share your data and jumping through baroque hoops to try and understand which cookies you need or not. So far this just makes everything worse for both businesses and consumers.
25: REFERENDUM ON LAW THAT REPLACED MONEY BAIL WITH SYSTEM BASED ON PUBLIC SAFETY AND FLIGHT RISK
Yes. There seems to be some conflict over whether this reform is good enough, but a system where the wealthy go free and the poor are stuck in prison until trial is unfair. We need to wring the profit out of the criminal justice system and this is a reasonable step in that direction.
By Robert Ellison. Updated on Monday, September 29, 2025.
I don't like to vote if I can't string together a rationale that I'm willing to post on my blog, so here are my recommendations for the San Francisco November 2020 ballot measures. It's been a tough year for the city. My neighbors are moving somewhere cheaper and less smoky, I see more houses on the market then usual as I walk around. It's hard to know what the next year will bring and to what extent tech jobs will end up shifting out of the bay area as the giants are forced to match work from home policies and smaller companies follow suit. What's clear to me is that we need to stimulate recovery and stop the city from becoming a worse place to live. And beyond that my ultimate dream of just throwing the politicians out if they're doing a lousy job rather than slogging through ballot measures for them. Until that day, here we go:
A: Health and Homelessness, Parks, and Streets Bond
Yes. The problem with homelessness is only getting worse and the construction will create jobs.
B: Department of Sanitation and Streets, Sanitation and Streets Commission, and Public Works Commission
Yes. The streets are a mess, so anything that shakes up the current system seems like it's worth a try.
C: Removing Citizenship Requirements for Members of City Bodies
Yes. Given the huge number of non-citizens paying taxes and otherwise contributing to the city it makes sense to allow them to participate in civic life. I don't support allowing non-citizens to vote but have no objection to them serving on a commission or other city body.
Yes. I really struggle with American policing. We have SF park rangers, community college police, university police, SFPD, sheriffs, highway patrol and other state police. That's without even starting to think about the various federal TLAs and transportation related agencies. Maybe before defunding the police we should first just spend a few years merging most of them and saving on administrative and uniform design costs? Having said all that I find it very hard to vote against more oversight for a department mainly concerned with running jails that organizes fight clubs at those jails. FFS.
Yes. I've never been in love with the payroll tax and moving to gross receipts with a higher exemption helps small business and startups. Seems like a good trade off.
Yes. I don't ride Caltrain often but I love it. My dream is coming back from a meeting on the peninsula in a comfortable top deck seat with a couple of cheap canned Gin and Tonics. We need more public transportation and we need it more than ever.
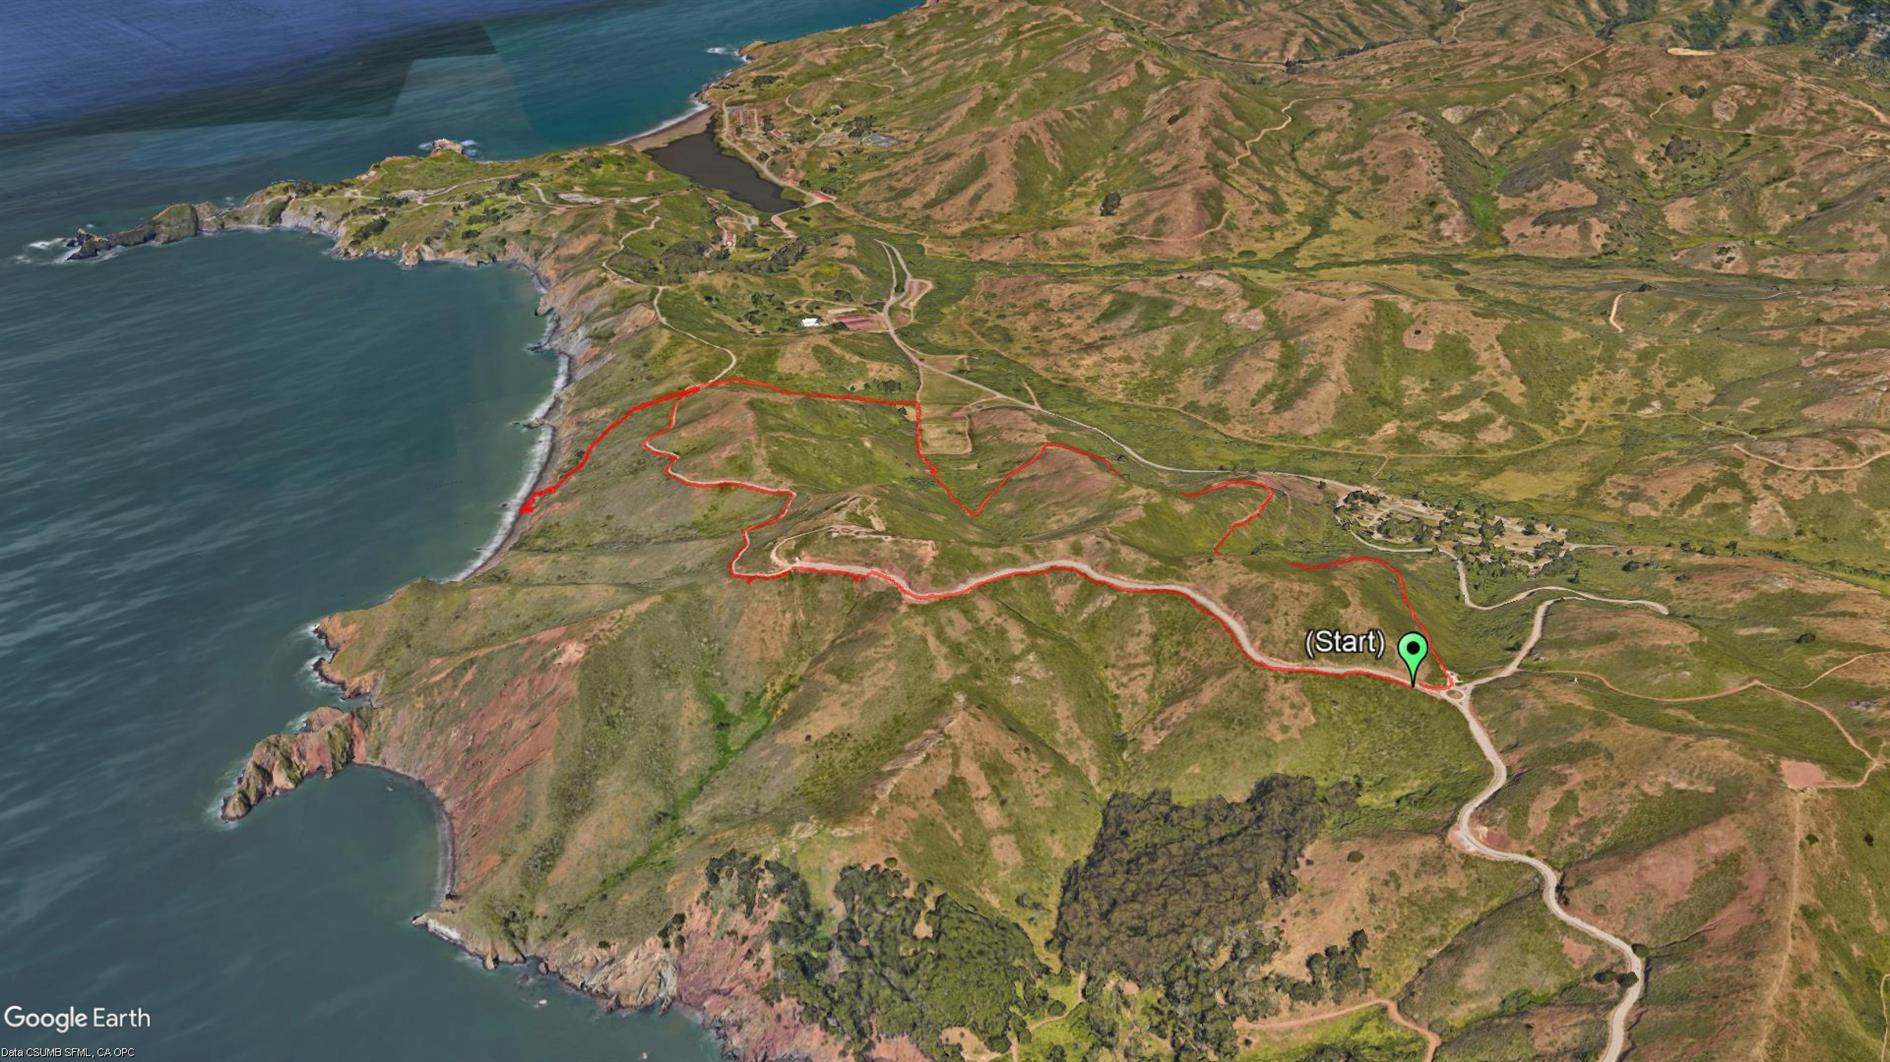
A four mile loop in the Marin Headlands including the beach detour. It starts at the roundabout and goes up to Hawk Hill and Nike missile control site. Then it plunges down the coastal road to the Black Sands Beach parking lot. If you go down to the beach (which you should) you then have a steep climb back up and take Upper Fisherman's Trial back down into Rodeo Valley before heading uphill again on Julian trail to the roundabout. Great views back over Rodeo Valley in addition to the dramatic descent down the coast mean this is worth doing once. Around a third of the hike is pretty close to the road which is the only real downside of this loop.
(Published to the Fediverse as:
Coastal and Julian loop plus Black Sands Beach #hike#marinheadlands#blacksandsbeach#map A Marin headlands hike taking in a couple of trails with awesome views and a detour to Black Sands Beach.)
By Robert Ellison. Updated on Thursday, August 26, 2021.
You have to make allowances for the fact that many people are working from home (where maybe it's harder to test code and you certainly can't do hallway usability testing). Things also improved somewhat with the October patch. But Android 11 was a Windows ME level disaster. Google says that they dropped the desserts to make Android 'more accessible to a global audience' but I think it's probably because they know that new updates are no longer sweet.
Multi-tasking is completely broken. In pandemic mode I'm on video calls all day, and dodging the 2-3 video calls that are usually going on elsewhere in my house. Being able to have Teams and notes running at the same time is pretty important right now and with 11 it's not possible.
Other than conference calls and Kindle the other main use I have for my phone is podcasts. Android 11 improved the media controls by moving them to the quick settings area of the notification shade, providing easy switching between playback devices and allowing you to swipe through recent playback apps. All good, except that none of it works. The controls are there but do nothing so I have to run the app to pause. Also, there is a weird ghost of a previous media playback that shows up and then disappears when pulling down the notification shade. And as for dismissing previous sessions that seems to require a reboot.
Multi-tasking and media were fixed in the most recent patch, but there is also some new notification system to separate out conversations. In practice this seems to mean I get multiple groups of Gmail and Teams notifications instead of a single cluster per app. This isn't what I want, gives me more work to do and so far I haven't found a way to turn it off. Notifications have steadily improved over the last few major Android releases so it's upsetting to see them becoming worse.
This is all on a Pixel 4XL which you would assume would get some level of testing love. It used to be that the main advantage of a Pixel was getting new versions of Android quickly. With 11 I'm for the first time wishing I was waiting a few months while the kinks were worked out.
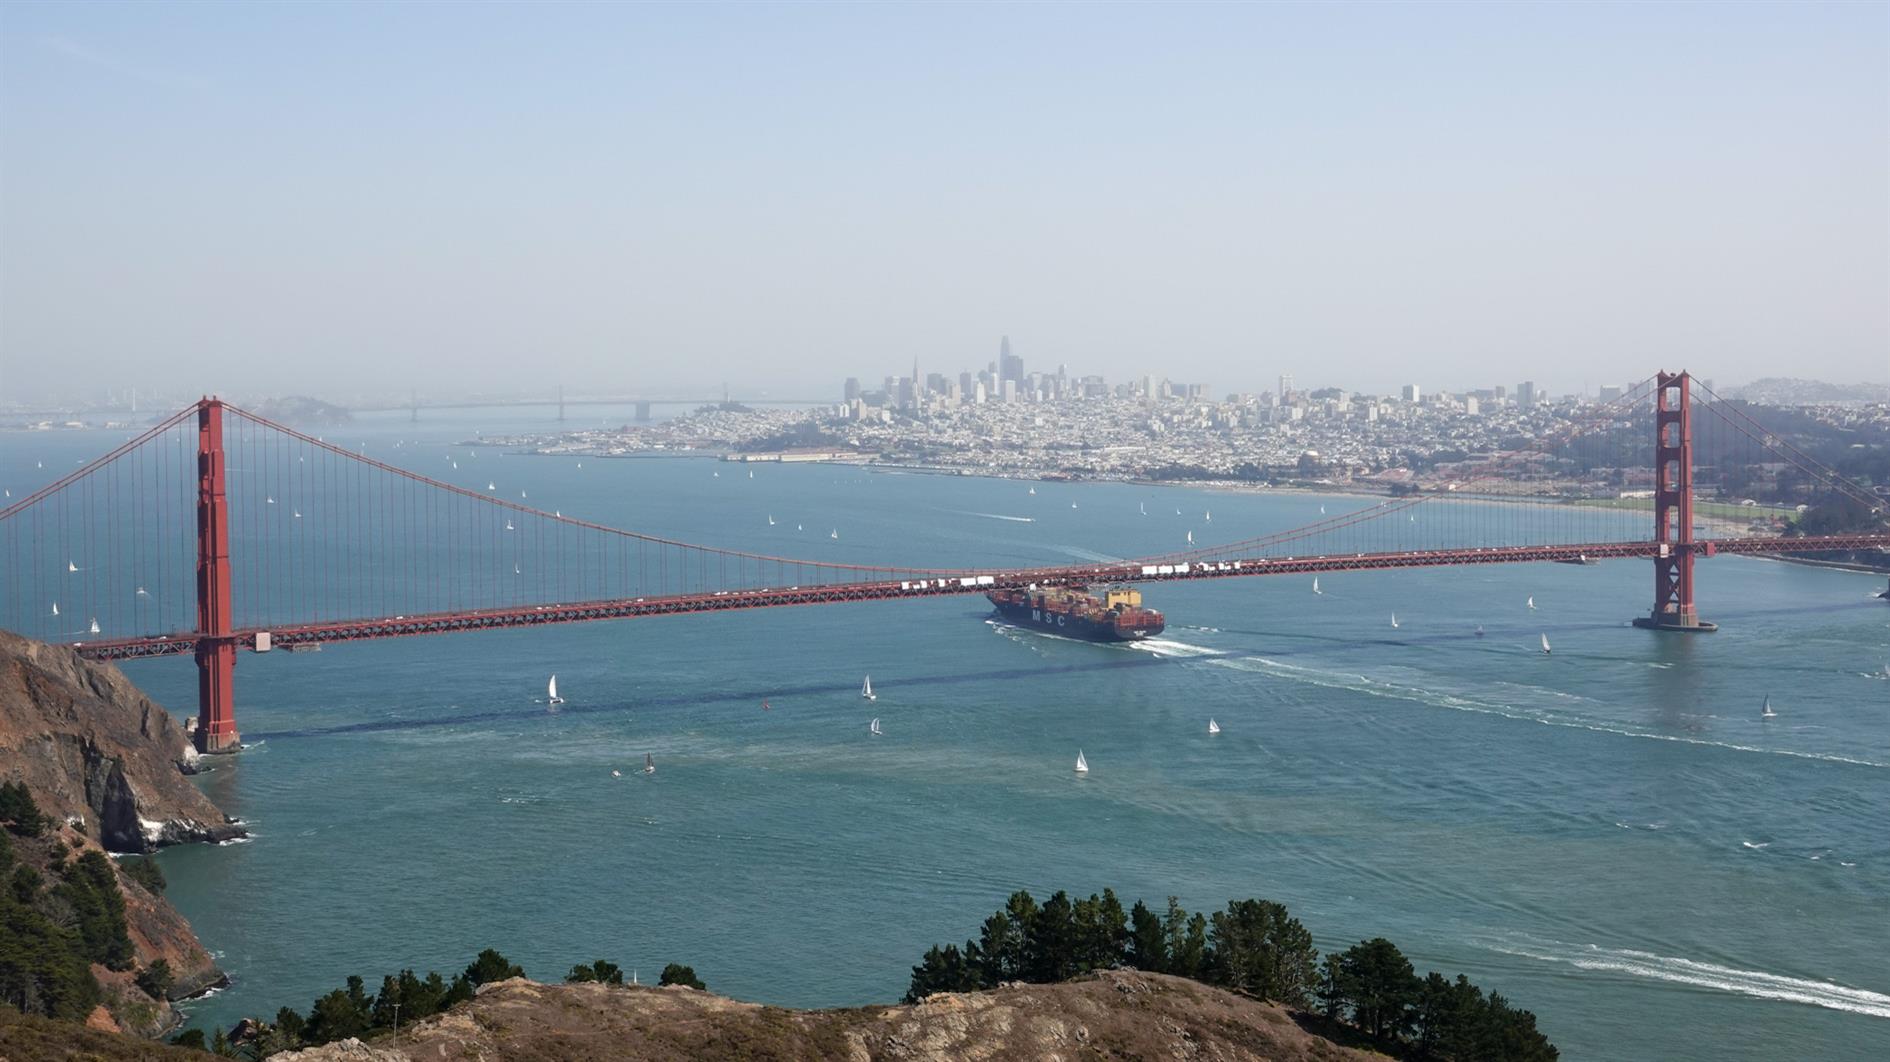
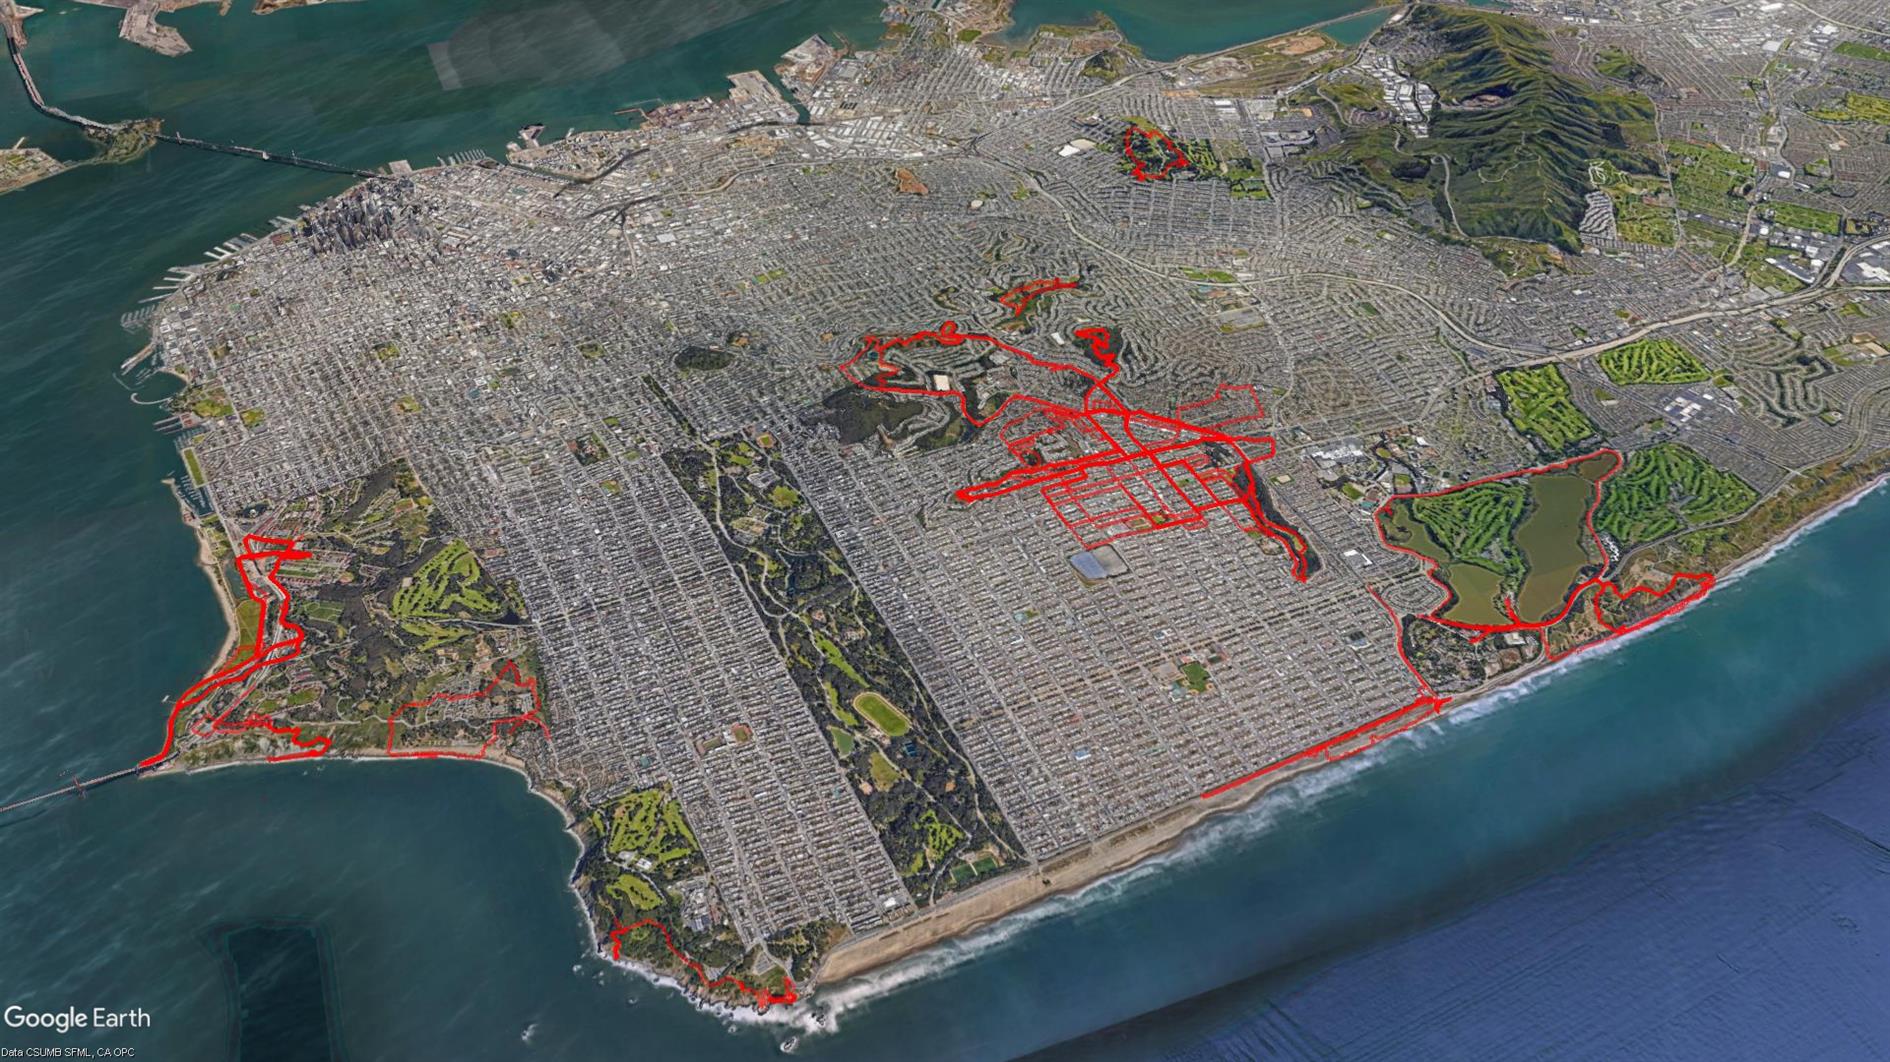
The Google Earth screenshot above is a composite of all of our Coronavirus hikes from March to October. We have thrashed the sidewalk around our neighborhood, discovered some new favorites and gone from hyper-local to a more normal regime. I'm not going to track these specifically any more and will return to blogging new hikes that you'd do even if not forced to by circumstances.
(Published to the Fediverse as:
Coronavirus Hikes: Done #hike#coronavirus Final map of many coronavirus hikes in and around our neighborhood. Have discovered some pretty good out of the front door routes.)
By Robert Ellison. Updated on Sunday, September 28, 2025.
Please vote for Biden. Do it as early as you can so Trump is crushed on election day and we don't have to suffer through weeks or months of uncertainty and possible election stealing.
I'm endorsing Biden because of these 923 reasons (and counting) and the 20,055 lies (and counting). Trump has likely killed tens of thousands of Americans, possibly hundreds of thousands before he leaves office. I wasn't a fan before the pandemic either.
Voting in the presidential election from California sucks. While the largest state burns, Climate Change is #32 on on Biden's list of policies. He's against the Green New Deal (the one that would pay for itself). Our broken electoral system means that the best possible outcome is a milquetoast centrist caretaker who probably won't do too much harm until it's someone else's turn. But make no mistake, it is the best possible outcome so I'll suck it up and vote.
"I'd go Warren, Sanders, Kloubuchar, Biden, Yang, Buttigeg, Steyer, Bloomberg and (sorry again) Gabbard. Although, full disclosure, if it would get rid of Trump I'd vote for a McConnell/Graham ticket."