Pandemic Gas Mystery
For no good reason I downloaded my gas and electricity consumption data by day for the last couple of years.
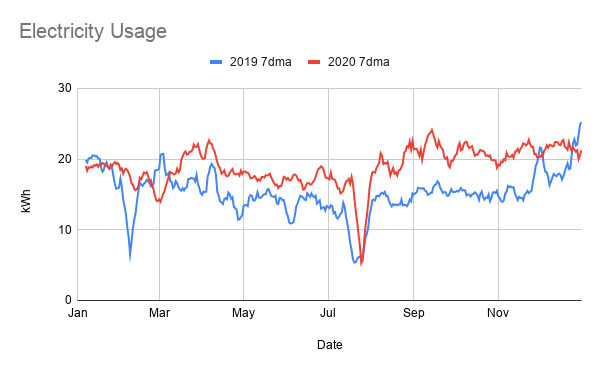
The electricity trend is unsurprising. At the start of the pandemic it jumps up and stays up. With work and school from home we're running four computers non-stop, burning lights and (the horror) printing things. Overall we used 24% more electricity in 2020.
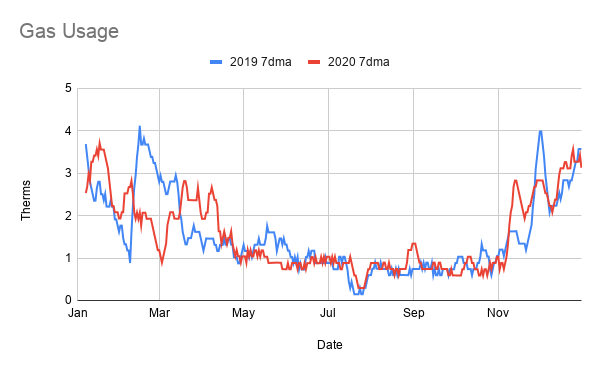
Gas on the other hand is pretty flat. There are some different peaks at the start and end of the year, but our total gas consumption increased by 0.08%. This doesn't make any sense to me. Being at home doesn't make much of a difference to laundry but it should have had a big impact on everything else. The heating has been on way more, we're cooking breakfasts and lunches that would have occurred out of the house in 2019 and we must be using more hot water as well.
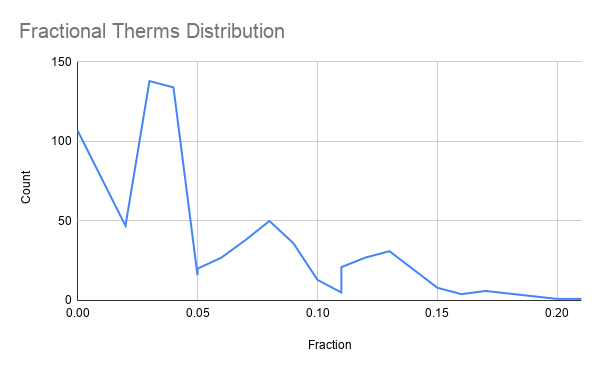
There is one strange difference between how electricity and gas are metered. Fractional kWh are distributed randomly between .00 and .99 as you'd expect. Fractional therms are totally different - we're apparently likely to use 1.02 or 2.03 therms but never 1.50. This feels like it must be some sort of rounding or other billing oddness but I can't find any reasonable explanation despite asking Google three different ways.
In a move that I might come to bitterly regret I have emailed PG&E to see if they can explain it. I'll update this post if I hear back. Or if you're a therm metering expert please leave a comment!
Updated 2021-02-20 13:51:
PG&E say:
"Thank you for contacting our Customer Service Center. Gas usage is registered by recording therms usage. If you view your daily usage online, you will see that therms are only registered in whole units. The only pace that you will see therms not as whole units is when you review the average daily usage. The pandemic started in March 2020 and since then your gas usage is up slightly versus previous years. Most customers will see a larger increase in electric usage versus gas usage when staying home more than normal. The majority of customers set the tempatures of the their heaters to very similar temperatures year over year and your heater will work to keep your house at the temperature whether you are home or not at home."
So the fractional therms are some sort of odd rounding on the downloaded data. Fair enough.
The majority of customers use the same temperature setting? Really? So that might be a good explanation if you constantly heat your house to the same temperature, but I know for sure that isn't us. We have a Nest Learning Thermostat and as I've previously reported this doesn't so much learn as just constantly turn the heating off. So staying warm is a constant battle with the thing.
Maybe the difference is that the pandemic started around Spring when San Francisco is warm enough to not need much heating. I'll look again when I can just compare winter vs winter in a couple of months.
Updated 2023-08-06 18:11:
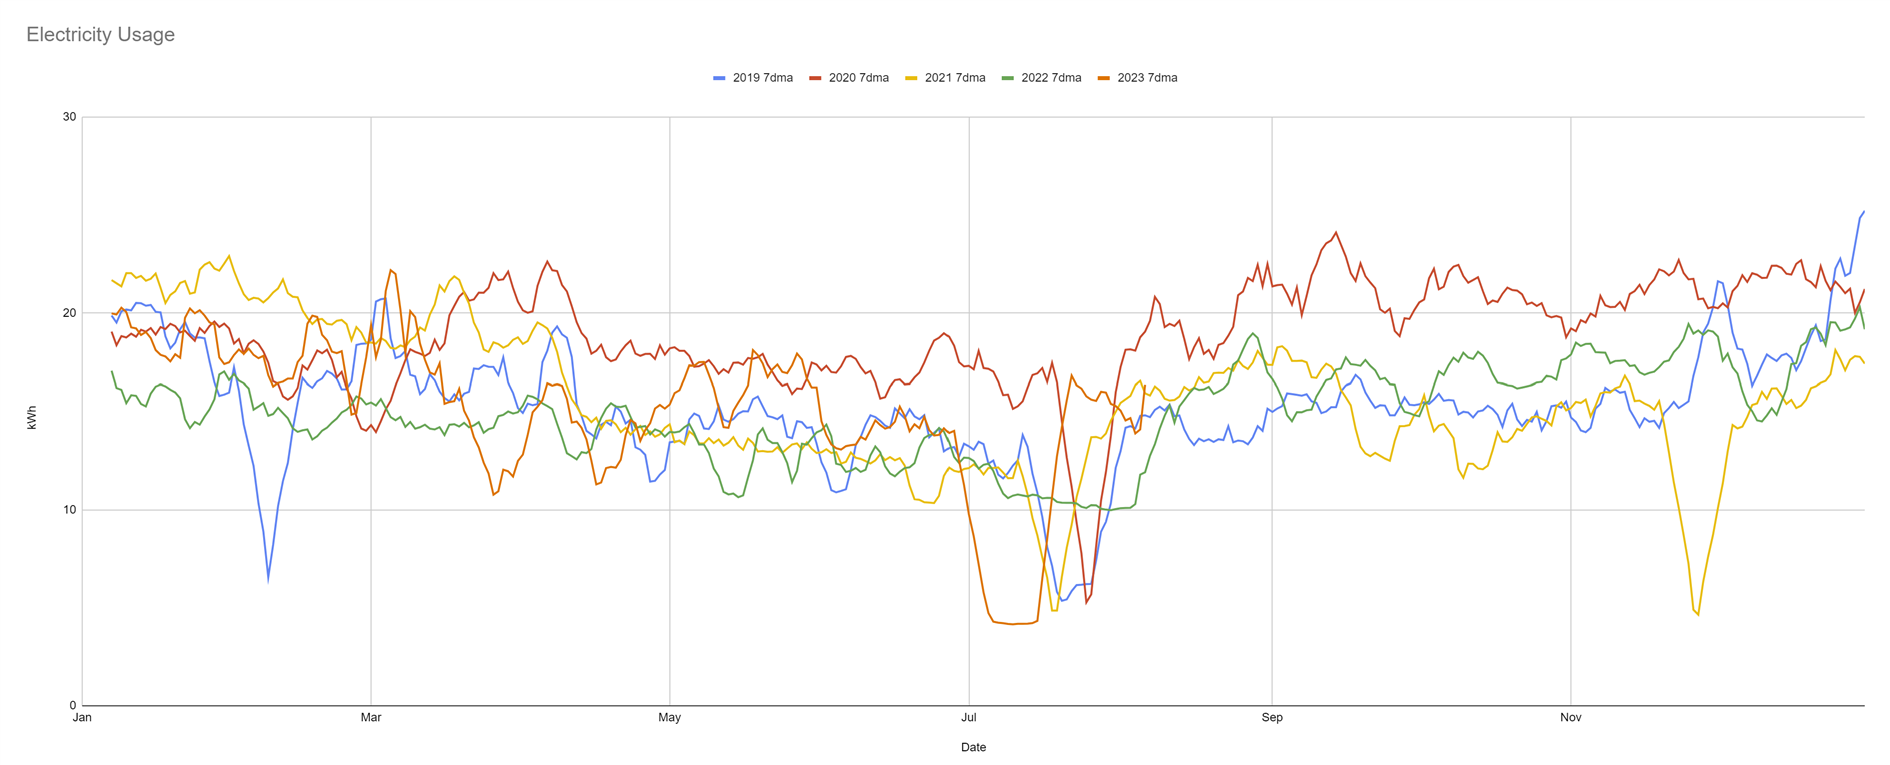
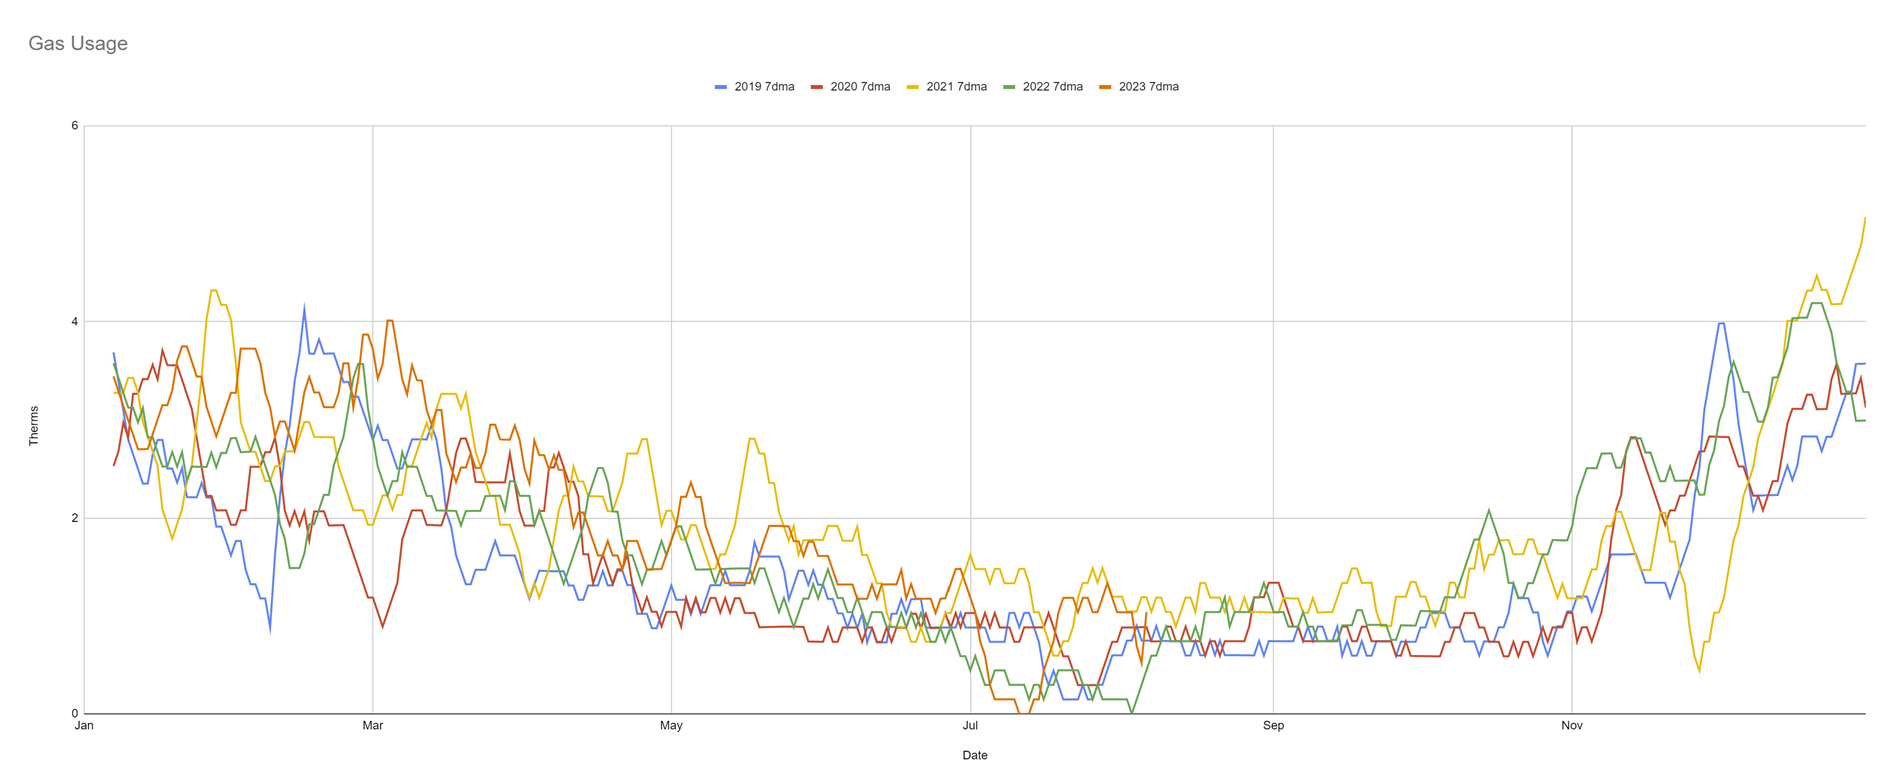
Took a while to update, but here is some more data. Electricity stayed high until Spring 2021 and then dropped to roughly pre-pandemic levels. This is because I spent a lot of time in 2021 upgrading lighting. My house has a different type of fixture/bulb in every room making this a painful process but I'm almost 100% LED at this point which has made a difference. Gas on the other hand has got higher and stayed there and I should really replace some more windows and add some more insulation...
I really wish the utility companies made this data available through some useful API instead of needing to download the occasional CSV. I'd build a dashboard and obsess over energy usage far more.
Add Comment
All comments are moderated. Your email address is used to display a Gravatar and optionally for notification of new comments and to sign up for the newsletter.