Google just released URL inspection as part of the Search Console API. I check for issues periodically in Search Console but it would be great to just get an email when an issue crops up. The Apps Script project below does just that by monitoring URLs from your sitemap for changes and sending an email whenever anything is detected. The Search Console API has a limit of 2,000 calls per day and Apps Script also imposes a time limit on scripts. The approach I take below assigns a random day of the week to each URL to limit the number checked on each run. Depending on the size of your site you may want to remove this check (or go the other way if you have a large number of URLs to monitor). Follow the steps below to get your own monitoring spreadsheet up and running.
Google Sheet
Create a new spreadsheet in Google Drive and call it anything you want. Rename an empty sheet to 'gsc', this sheet will store the index data. You don't need to make any other changes to this sheet.
Choose Apps Script from the Extensions menu. This will open up the script editor for your spreadsheet. I find that sometimes the editor opens with the wrong account if you're signed into more than one. If that applies to you, check quickly to make sure the right account is selected. With Code.gs selected copy and paste the script below replacing the default function:
There are a few configuration variables to enter at the top. AlertEmail is the email address to notify when index status changes are detected. SitemapUrl is the full URL of your sitemap. The current implementation does not support sitemap index files, this needs to be a regular sitemap containing URLs. SearchConsoleProperty should be the URL of the site to monitor, or sc-domain: followed by the domain for domain properties (for this site sc-domain:ithoughthecamewithyou.com).
Click Project Settings (the cog in the left hand menu of the script editor) and copy the Script ID. Make a note of this for later.
Create a new project (click the drop down to the right of 'Google Cloud Platform Console' and then New Project). Pick any name you like.
Once the project is created, find APIs and Services in the left hand menu and choose Library.
Search for Search Console, click on the Search Console API and then click Enable.
A new screen will load, click Credentials in the left hand menu.
Click Configure Consent Screen and choose the internal type.
Fill in the required fields - application name and contact emails.
Add the ./auth/webmasters.readonly scope for readonly access to Search Console data.
Once the consent screen is complete click Credentials in the left hand menu again.
Click Create Credentials at the top and choose OAuth Client ID.
Choose Web Application.
Add https://script.google.com/macros/d/{SCRIPTID}/usercallback to authorized redirect URLs, replacing {SCRIPTID} including the brackets with the Apps Script ID you noted above.
Make a note of the Project ID.
Complete the Apps Script
Return to the Apps Script project and find the settings page. Set the GCP project to the project ID you noted above. Also on this page check the Show "appsscript.json" manifest file in editor option.
Go to the code editor and open appsscript.json. Add the following line:
Make sure the script is saved and close the script editor window. Reload the spreadsheet. Once the reload completes you should have a Search Console menu at the top of the spreadsheet. Choose Update Data from the Search Console menu. This will run for a few minutes and then populate the 'gsc' sheet with your URL data. See UrlInspectionResult in the API documentation for more information about the meaning of each field. You should also get a lengthy email with a notification for each URL that was inspected. This will continue for the first week and then you'll only get updates for interesting status changes.
Scheduling
Now the project is working, open the script editor again (Apps Script from the Extensions menu) and open Triggers (the clock icon in the left hand menu). Click Add Trigger at the very bottom right of the window. Select runUpdate as the function to run. Change event source to time-driven, and then select day timer and an hour to run the script. Lastly click Save. Your Google Search Console monitor will now run every day, and if the index status of a page changes you'll get an email about it within a week. The spreadsheet will also come in handy for other analysis and reporting.
Troubleshooting
You might need to tweak the script if you start hitting limits. The URL inspection API currently has a 2,000 call / day quota. Apps Script will only run for around 7 mins on a free account and 20 mins if you have Google Workspace. If either of these limits apply you could modify the 'checkDay' logic to use day of the month (or year, or ...) to reduce the number of URLs inspected on each run. If you need to do this remember to update the Check Day column on the 'gsc' sheet as well.
The script assumes that the URLs you want to monitor are in your sitemap. If this is not the case you can add URLs to the sheet directly. As long as they are part of the configured property you will still get results. If you use this method you might want to comment out the updatePagesFromSitemap() call in runUpdate() to save time.
If anything else goes wrong please leave a comment below and I'll do my best to help you.
Updated 2022-02-08 17:40:
After a couple of days I have a full dump of my sitemap from the page index status API. I wrote this script for the alerting possibilities but couldn't resist some analytics once the dataset was complete.
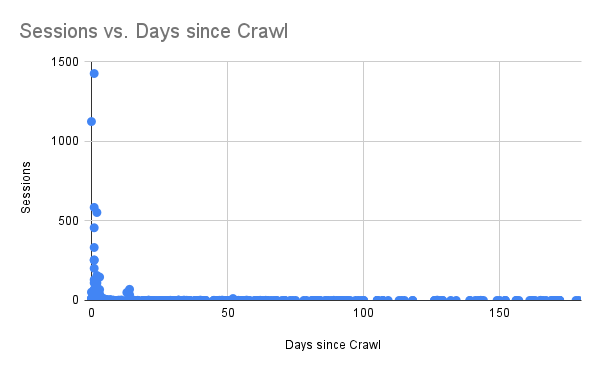
The chart above shows sessions vs days since the last Google Crawl. Pretty stark - Google keeps a close eye on the pages it sends traffic to and not so much on the others.
I set lastmod honestly and there is good news here. I could only find two cases where Google had not crawled the page since the last modified date. So when the sitemap says a page has changed the odds are good that it will get another crack at the index. The two exceptions are unusual posts that are updated hourly and weekly respectively and both have been crawled recently.
The breakdown of index status matches Google Search Console pretty well but I have a handful of pages that are 'Indexed, not submitted in sitemap', even though they are in the sitemap and no such status is shown on Search Console. I don't know if this is a glitch in the index status API or something to do with how the pages were discovered. Some light searching suggests that this message is usually what you would expect it to be.
Lastly, updating the sheet for my site is more bound by script execution time than the API limits. I changed it to run every hour and instead of partitioning by day of week I used a random hour of the day which means I check every URL at least once every 24 hours.
Updated 2022-04-24 10:50:
I just updated the code and post above. I've had occasional issues where updating the sheet failed which caused the next run to go back to the beginning with no saved index status. To reduce the chance of this happening I've added some retry logic and also improved the speed of the sheet load and save functions. I also had a comment on the code that suggested an easier way to handle OAuth and have incorporated this in the new version.
(Published to the Fediverse as:
Monitor page index status with Google Sheets, Apps Script and the Google Search Console API #code#searchconsole#appsscript#google#sheets#drive#seo How to use Apps Script in Google Sheets to automatically monitor index status in Google Search Console and get an email alert if anything changes.)
By Robert Ellison. Updated on Saturday, February 19, 2022.
Sun halo over Lake Merced, a container ship entering the bay, the SkyStar ferris wheel in the Golden Gate Park, Farallon Islands, and some nice clouds over the Pacific. Photo is from Lake Merced.
(Published to the Fediverse as:
Sunset #8 #timelapse#sunset#4k#video 4k 60fps time lapse of sunset over the Pacific shot from San Francisco, California.)
By Robert Ellison. Updated on Saturday, February 19, 2022.
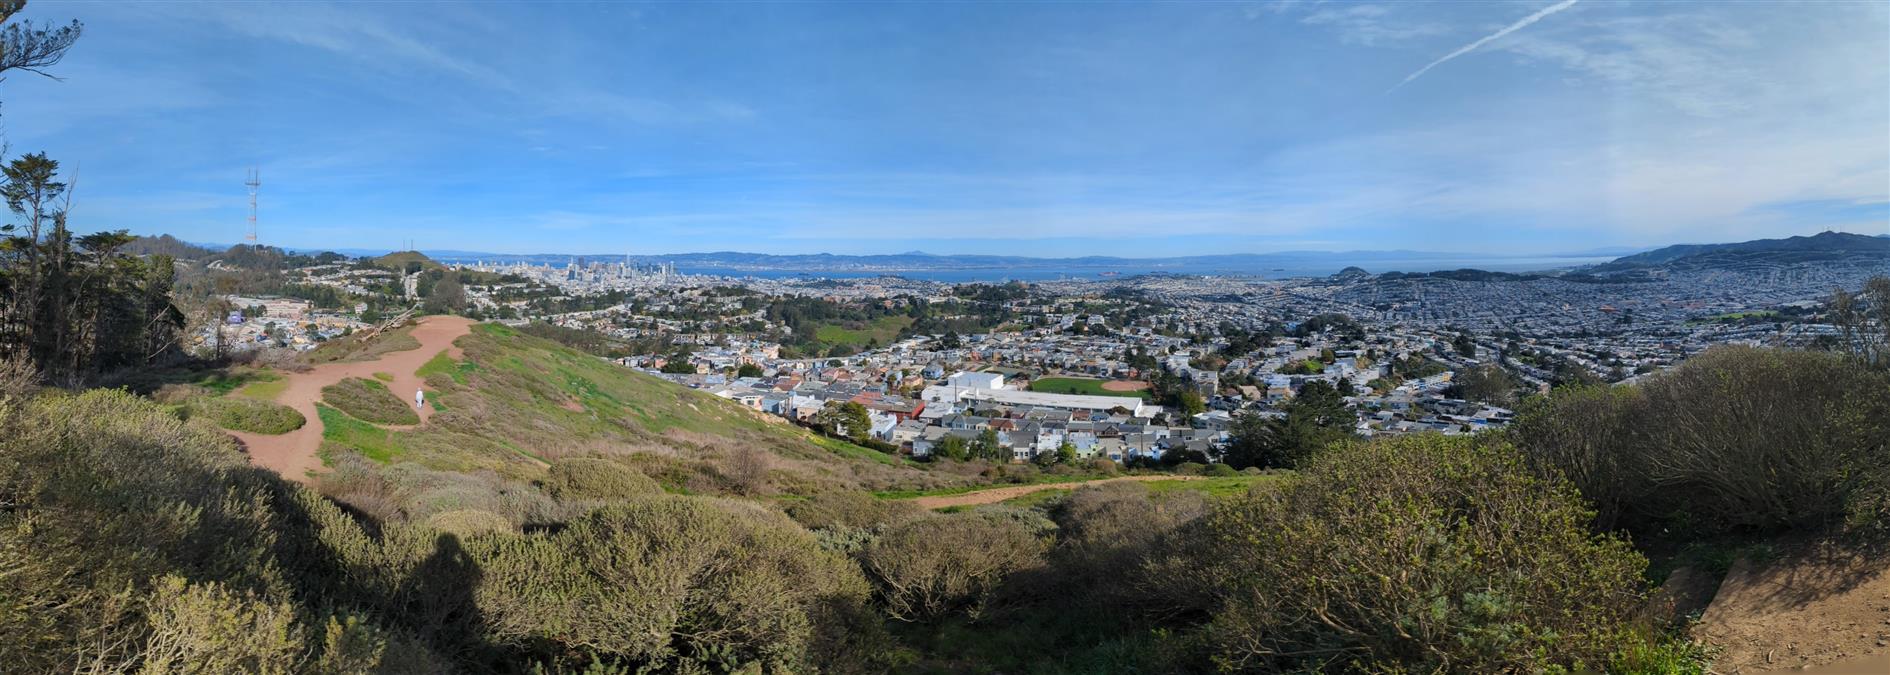
Three different perspectives of downtown San Francisco. Shot from Twin Peaks (with a great view all the way down Market Street), Mount Davidson (the highest point in the city) and of course Grand View Park.
By Robert Ellison. Updated on Monday, September 29, 2025.
Continuing myseries of local coronavirus hikes, Mount Davidson is the highest peak in San Francisco and this three mile hike takes you there from West Portal. Take Ulloa to Kensington and then cross Portola on the footbridge. Juanita takes you to one of the Mount Davidson trails and up to the top. You can come back the same way, or follow Kensington all the way over to Taraval.
The cross at the top is a memorial to the Armenian Genocide and while most of Mount Davidson is a San Francisco park the area at the top is owned by the Council of Armenian-American Organizations of Northern California (due to a church/state separation lawsuit). It's a great spot to look (slightly) down on the Twin Peaks set who just think they've reached the top of San Francisco.
By Robert Ellison. Updated on Saturday, October 4, 2025.
I got a Rent Board Fee Annual Notice for the first time this year which says:
"The owner of each residential unit in San Francisco, as specified in Administrative Code Chapter 37A, shall pay annually to the City and County of San Francisco a Residential Rent Stabilization and Arbitration Board fee."
Which sounds like they really want you to pay. They go on to say that from the 2021-2022 tax year the Rent Board has to collect directly from the property owner rather than being bundled on the property tax bill.
This seems crazy. Not that I'm advocating kicking off another recall election but it must be a monumental waste of resources. Suddenly you're sending me letters and wasting my time as well as paying extra credit card / check processing fees all for $59 which is a pretty trivial fraction of my property tax.
It turns out that I don't even need to pay - owner occupied units are exempt. This made me wonder if I have been inadvertently subsidizing the Rent Board for years but as far as I can tell this has never been included with my property taxes. It certainly isn't broken out like other special fees (and San Francisco feels like it needs to let me know that 0.05% of my tax is going toward restoring the bay). You can opt out of the tax on a sumptuous new Rent Board portal, which can't have been cheap to build.
So what gives? I haven't seen any press on this. Please let me know if I missed something. My best guess is that whatever records were used to add the tax to the property bill were thought to be incomplete and so the Rent Board is trying to expand its tax base to all of the undeclared in-law units and casually rented rooms in the city. Less charitably they might be hoping that a lot of property owners pay the new bill without checking the details. Regardless, if we need a Rent Board can it not just be paid for out of city funds instead of wasting trees and time and money on an elaborate separate payment system?
(Published to the Fediverse as:
What is the San Francisco Rent Board Fee? #politics#sanfrancisco The San Francisco Rent Board has sent fee collection notices to all San Francisco households, which you don't need to pay if you are owner occupied.)
By Robert Ellison. Updated on Saturday, February 19, 2022.
An experiment in creating a timelapse from a week of walking around San Francisco. Not sure how long I'll keep this up for and only managed four sequences this week: three different views from Grand View park (I go there a lot) and one of the penguin sculpture at Lake Merced.
ITHCWY has obtained an exclusive transcript of the speech that President Biden should have given the other week. We can’t reveal our source in the West Wing, but have made every effort to verify that the country would be on a completely different course if Biden had picked up the right draft on his way out the door.
THE PRESIDENT: Like many Americans I’ve wondered why we can’t get the basics done. Basics that the majority of Americans support and that most other developed countries take for granted. Basics like education, healthcare, childcare, and stewardship of the environment for future generations.
I’ve been having these quiet conversations, mostly with Senators Sinema and Manchin, whose names I would barely know if Americans’ votes counted the same. I’m tired of being quiet! (Applause.)
Folks, I’m the Commander in Chief of our nation’s great amed services. The 107th Congress passed an irresponsibly broad and open ended Authorization for Use of Military Force which I am today using to declare war on American Mediocrity. (Applause.)
In 2005 I cried as Howard Plummer died at the hands of Serbian rebels And then laughed as Navy SEAL lieutenant Shane Wolfe took care of his family. The Pacifier left me with a conviction that our youngest children are best handled by special forces. I hereby task the SEALS, Rangers, Delta, and the rest of SOCOM with establishing universal pre-K and free childcare so that hard working Americans can focus on their vital missions. (Applause.)
F-35s are cool, when they’re not spontaneously combusting, and I love a presser on an aircraft carrier as much as the next President. But the Pentagon has determined that climate change is a threat to national security. We need to be equipped to fight the current war, not the last one. All current Pentagon procurement programs are canceled. We must protect our world beating defense industry and so General Dynamics, Raytheon and other contractors will immediately pivot to solar, wind and carbon capture and storage technologies.
Our great intelligence community will play a role as well, by infiltrating deep behind enemy lines and then planting a tree or two.
We can’t fight this war on mediocrity if we’re sick. That’s why I’m directing the Department of Veterans Affairs to start providing healthcare for any (and I mean any) potential future veteran in addition to our existing veterans. (Applause.) And we can’t fight this war if we’re dumb. The Military, Naval and Air Force academies will start to offer free university education to every American, in exchange for a year of national service in uniform or otherwise. (Applause.)
Our seniors deserve better as well. The Coast Guard will develop a new generation of Cutters that include thousands of staterooms. We will protect our maritime borders while providing accommodation, community and a diverse range of entertainment to retired Americans.
These programs will pay for themselves as we stop wasting money on expensive boondoggles and our forces will be too exhausted for any misadventures overseas. The only part of Build Back Better that won’t get done is reversing the SALT tax rise and folks, I’ve had second thoughts about that anyway. (Applause.)
(Published to the Fediverse as:
Build Back Betterer #politics#biden Exclusive transcript of the speech that President Biden should have given the other week.)