Get an email when a new OpenAI model is available via the API
Here's a simple Google Apps Script to monitor for new OpenAI models:
To get this running, paste into a new Apps Script project and enable the Gmail API under services. Add your email address and OpenAI API Key at the top. Run a couple of times and you should get an email with all the current models and then nothing the second time unless you get lucky. On Triggers set a scheduled execution with whatever frequency feels good (I use daily) and you're all set.
More Google Apps Script Projects
- Using the Azure Monitor REST API from Google Apps Script
- Automate Google PageSpeed Insights and Core Web Vitals (CrUX) Logging with Apps Script
- Get an email when your security camera sees something new (Apps Script + Cloud Vision)
- Get an email if your site stops being mobile friendly (no longer available)
- Adding AI to Todoist with Google Apps Script and OpenAI
- How to backup Google Photos to Google Drive automatically after July 2019 with Apps Script
- Email Alerts for new Referers in Google Analytics using Apps Script
- Control LIFX WiFi light bulbs from Google Apps Script
- Monitor page index status with Google Sheets, Apps Script and the Google Search Console API
- Animation of a year of Global Cloud Cover
- Using the Todoist API to set a due date on the Alexa integration to-do list (with Apps Script)
- Export Google Fit Daily Steps, Weight and Distance to a Google Sheet
(Published to the Fediverse as: Get an email when a new OpenAI model is available via the API #code #software #appsscript #google #gmail #openai #ai Simple Google Apps Script project that will send you an email any time OpenAI releases a new model to their API. )
Yerba Buena Island Timelapse
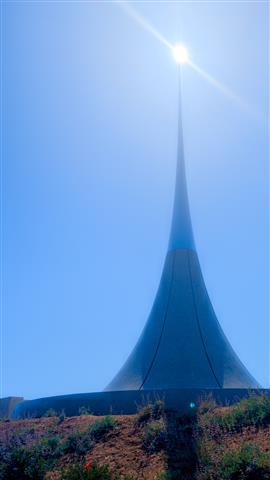
Timelapse shot from Panoramic Park at the top of Yerba Buena Island. This features the Point of Infinity sculpture, the Bay Bridge, Treasure Island, Angel Island, Alcatraz, the Golden Gate Bridge and downtown San Francisco.
Related Posts
- Treasure Island
- Both sides of the Golden Gate, a Time Lapse
- Embarcadero
- San Francisco New Year's Eve Timelapse
- San Francisco New Year's Eve Timelapse 2020
(Published to the Fediverse as: Yerba Buena Island Timelapse #timelapse #video #sanfrancisco #baybridge #goldengatebridge #angelisland #treasureisland #alcatraz Panoramic time lapse from Yerba Buena Island (Bay Bridge, Golden Gate Bridge, Islands and San Francisco) )
Set Todoist Label Colors Automatically Using OpenAI Embeddings
From the department of things I wouldn't have bothered with a year ago, here's a python script to set Todoist label colors.
Why? I like a productivity environment with some color and flare, and it also helps to visually recognize what a task relates to. But setting label colors is more clicks than I have patience for.
How? Just figure out embeddings for each available color and then for each label. Use cosine similarity to set the color that best suits each label. Colors will stay consistent for existing labels and new ones will get just a dash of semantic meaning in their assignments.
Here's the code (you need an OpenAI API key and a Todoist API token set as environment variables):
Related Posts
- Adding AI to Todoist with Google Apps Script and OpenAI
- Using the Todoist API to set a due date on the Alexa integration to-do list (with Apps Script)
- Style Transfer for Time Lapse Photography
- More Colors
- Upgrading from word2vec to OpenAI
(Published to the Fediverse as: Set Todoist Label Colors Automatically Using OpenAI Embeddings #code #python #openai #todoist #ai Python code that uses OpenAI embeddings to set Todoist task labels to a semantically meaningful color. )
Revolution
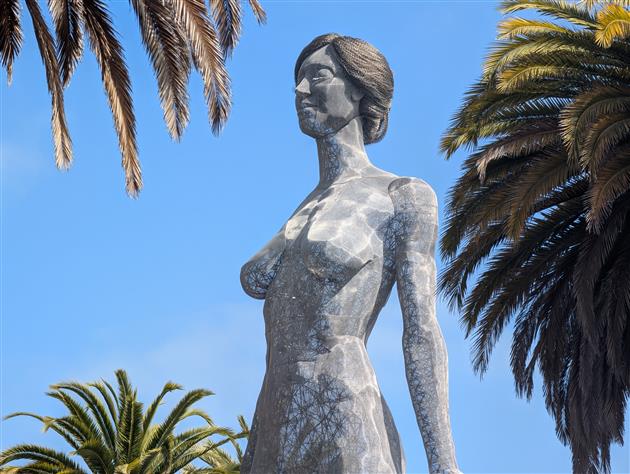
Google Pixel 8 Pro 18mm f2.8 1/257s ISO17
Ok, technically it's R:Evolution, towering over the end of Market Street trying to make downtown happen again while gazing at a haphazardly decorated utility box.
Related Posts
(Published to the Fediverse as: Revolution #photo #revolution #sanfrancisco Photo of the R:Evolution sculpture towering over the end of Market Street )
Vibe Coding a Vibe Video Editor
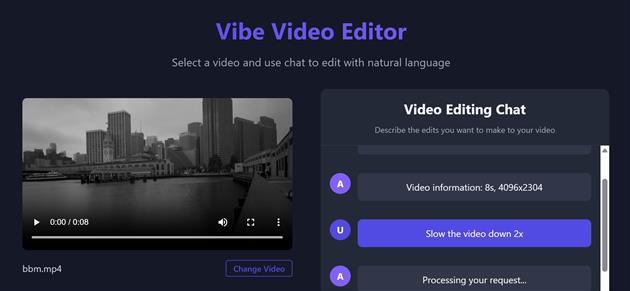
I set myself the goal this morning of shipping a vibe coded web application in a day. Welcome to the world, vibevideo.xyz, and apologies if you own Adobe stock.
Vibe Video is a chat based video editor. There are two things that are pretty cool about it. First, it writes its own code. When you ask it to make an edit it uses GPT 4.1 to write a function for the edit and then runs that function. That's the Vibe Video part. It's a single page JavaScript application but the core functionality is hallucinated at runtime.
Second, it runs locally. It's based on ffmpeg.wasm, which I knew nothing about before this morning. The site is a Vite/Svelte SPA deployed to a Cloudflare site with no backend except the OpenAI API. Your videos never leave your computer, and all the editing happens in the browser thanks to WebAssembly. I hadn't touched Vite or Svelte before today either.
Both of those things are crazy. There are some limitations - as the great saying goes, "If you are not embarrassed by the first version of your product, you’ve launched too late.". Right now you need to bring your own OpenAI API Key. Maybe I'll add some free usage when I get a grip on how much it costs to run. It's fast when you don't need to reencode - so trimming the video is quick. but changing resolution or speed will take some time. And there is a 2GB limit on file sizes, a limitation of WebAssembly. My hope is to iterate and improve, so kick the tires and let me know what else it needs.
To build this I used Visual Studio Code with GitHub Copilot in agent mode using Claude 3.7. The only code that's hand crafted is changing GPT 4 Turbo to GPT 4.1 (Claude refused to admit that 4.1 exists) and repeatedly removing a call to a non-existent file size property. While I didn't have to write any significant code I did need to coax the LLM - an experience halfway between being a product manager and pair programming with a buddy who is a much faster typist and won't allow you to touch the keyboard. There was a fair bit of troubleshooting involved as well, some with the environment setup and some with runtime errors. Having the experience to help guide Copilot through these helped a lot.
I have been experimenting with a lot of different tools over the past few weeks. Cursor and Windsurf both worked well for me, Replit was pretty good as well. Cline impressed me with debugging an app after building it. V0 and Lovable struggled with my test use case. I used Copilot for this personal experiment as I already have a license and wanted to see how far it would go. All of these tools are going to continue to improve (and/or merge). The current state of the art is a big deal already. A few weeks ago the statement that a good chunk of Y Combinator startups were writing 95%+ of their code with AI sounded like bullshit. Now I think they might be sandbagging.
One bad smell is that the experience gets worse as you add code. The start of the project was unbelievably easy, but as features were added Copilot started to bog down. This is unsurprising as the more you load up the context window for an LLM the more it struggles with the details. Again, this will just improve over time as models and agentic implementations improve. Good architecture is also going to matter - and is no different here from freeing regular developers from needing to keep too much in their head at the same time.
Related Posts
- Rob 2.0
- Aurora, the Raspberry Pi Smart Assistant
- DeepCoder
- Adding AI to Todoist with Google Apps Script and OpenAI
- Style Transfer for Time Lapse Photography
(Published to the Fediverse as: Vibe Coding a Vibe Video Editor #code #ai #vibe #openai #llm #anthropic How I built a video editing service in a day with GitHub Copilot and ffmpeg.wasm )
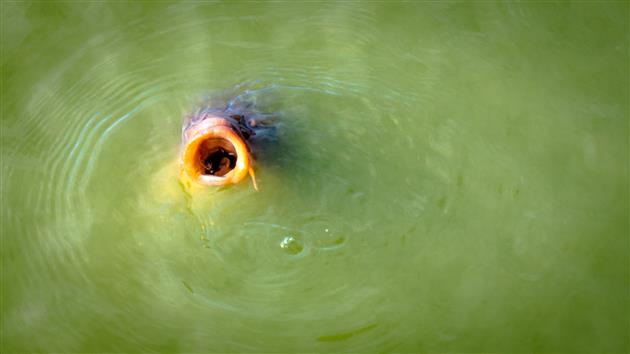
Begging Carp
Google Pixel 8 Pro 18mm f2.8 1/450s ISO120
A carp begs for food in Spreckels Lake, Golden Gate Park.
Related Posts
(Published to the Fediverse as: Begging Carp #photo #carp #goldengatepark Photo of a carp begging for a snack in Spreckels Lake, Golden Gate Park, California )
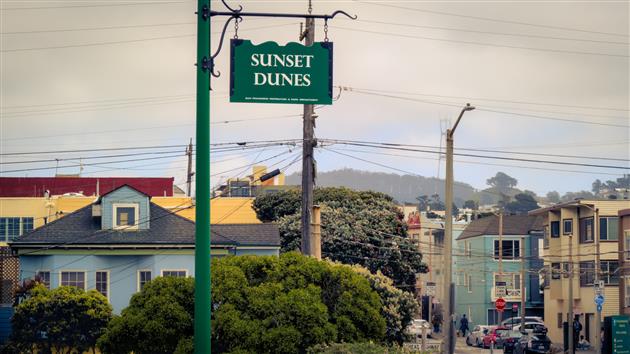
Sunset Dunes
Sunset Dunes is the newest park in San Francisco, created in the November 2024 election by a controversial ballot measure. It's a two mile stretch of the Great Highway that was often closed due to drifting sand. The road was also closed to traffic during the pandemic, a move popular enough to get enough support to convert it to a full time park. Many people are mad with this development due to traffic spilling onto neighboring streets and increased commute times, to the extent that there is a recall campaign against the local supervisor. I'm bored of recall campaigns and NIMBYs and voted in favor of the new park.
The video below is a hyperlapse of the two miles from the Golden Gate Park to Sloat Boulevard through Sunset Dunes and then the two miles back on Ocean Beach.
Not much has changed since the pandemic experience. This isn't surprising as the ballot measure didn't add any funding for the park. The two sides of the original Great Highway are divided into a slow lane and a fast lane which makes sense. There are a few street murals and art installations dotted along the road which are fine but seem beside the point. I hope this remains as a safe space to cycle, scoot, board and stroll.
Hike starts at: 37.767321, -122.509288. View in Google Earth.
Related Posts
- Remnants in the Sunset
- Sand on Great Highway
- Lands End
- GGNRA Dog Management Round 3
- Golden Gate Park - Stow Lake, Strawberry Hill and Museum Concourse
(Hike Map)
(Published to the Fediverse as: Sunset Dunes #hike #greathighway #sunsetdunes #sanfrancisco #video #hikevid #sfdogwalk #oceanbeach #ggp #map Four mile hike down the Sunset Dunes park and then up Ocean Beach in San Francisco, California.</span> )
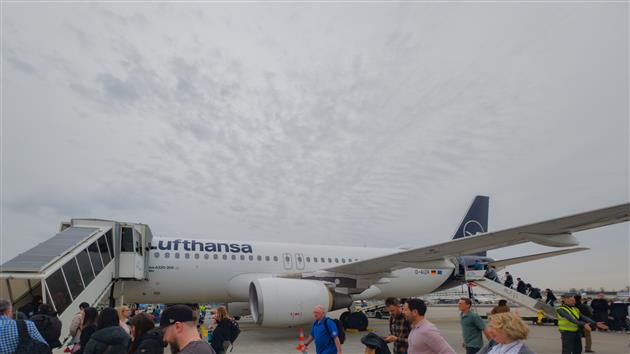
FRA BUD
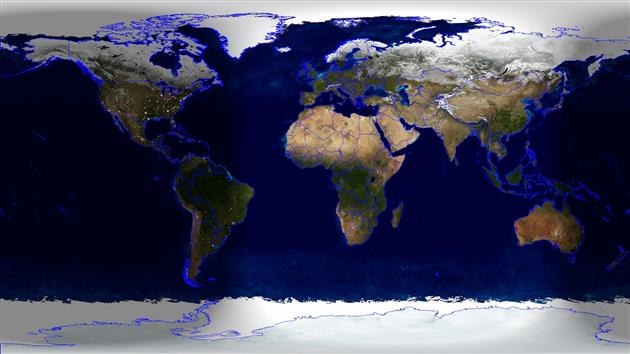
Vernal (Spring) Equinox 2025
Spring has sprung (09:02 UTC, March 20, 2025) for the Northern Hemisphere and Autumn is here if you are south of the Equator. Rendered in Catfood Earth.
Related Posts
- Animation of a year of Global Cloud Cover
- Improving the accuracy of the new Catfood Earth clouds layer
- Time Zone Time Lapse
- World Time Lapse
- Catfood Earth
(Published to the Fediverse as: Vernal (Spring) Equinox 2025 #code #earth #catfood #equinox #spring #vernal #autumn The exact moment (09:02 UTC, March 20, 2025) of the Spring Equinox in Catfood Earth. )
