By Robert Ellison. Updated on Wednesday, November 8, 2023.
I could build this in about the same amount of time it's going to take to describe it (love you Google Apps Script) but I'm not quite evil enough.
A good chunk of my work day is deleting endless B2B spam from aggressive salespeople who are certain that I should check out their SAAS whatever and pay $25/user/month for something I could do with a wiki page. Outlook for some reason doesn't recognize this stuff as spam even if you block it. LinkedIn is built to distribute this. It would be great to make it more expensive, painful and humiliating for these people to spray and pray.
My idea: it's Calendly only evil.
You reply saying how excited you are and provide a link to schedule an appointment. This allows them to book a slot and sends them a meeting request and a Zoom link. When they join they're just connected to some number of other salespeople who booked that slot.
Extra credit: record the meetings and auto-post to YouTube and use the ad revenue to pay for hosting costs.
As usual any of my billionaire readers who want to back this should get in touch.
Updated 2023-11-08 00:28:
It's like someone at Google read this post because they're rolling out a Meet API that would solve for the extra credit part of this idea. I'm having a hard time not rolling up my sleeves and building it.
(Published to the Fediverse as:
Stamp out B2B spam with an evil calendar #etc#lazyweb#calendar A modest proposal for a service to randomly connect salespeople together on useless video calls to raise the cost of spraying us with endless spam.)
Just in case it helps someone else I was able to fetch an Outlook iCal feed using C#'s WebClient for years until it stopped working in June, 2022 with a 400 / bad request error. I was downloading a set of calendars and the fix was just to use a new WebClient for each calendar so it must be some kind of state thing in WebClient.
To regain around 1% of sanity I have a task that pulls the various calendars that life throws at me and combines them into a single, de-duplicated calendar. The Google Calendar on my phone is gorgeous as a result. My primary calendar is orange and then all of the miscellanea are teal and unique. It would be great if Google Calendar could do this without help, but it was worth the effort not to have some random soccer match repeated five times in different colors.
Last week one calendar, an Outlook feed, started failing with 400 bad request.
Naturally I assumed that the server had started to suddenly care about some header or other and I started playing around with setting User-Agent and various Accept headers without any luck. To make debugging slightly easier I moved the Outlook calendar out of a loop (where I was iterating through a list of iCal feeds that I need to be aware of) and then it magically started working. The magic in this case must be a fresh WebClient and so the fix was to use a new WebClient for each calendar instead of reusing a single instance. It looks like WebClient is deprecated in .NET 6 and one is supposed to start using HttpClient instead so that's probably another fix but not one I'm going to wrestle with today.
(Published to the Fediverse as:
Outlook/Office iCal feed 400 bad request error with C# WebClient #code#c##outlook How to fix a 400 / bad request error with the C# WebClient when downloading an Office iCal feed.)
(Published to the Fediverse as:
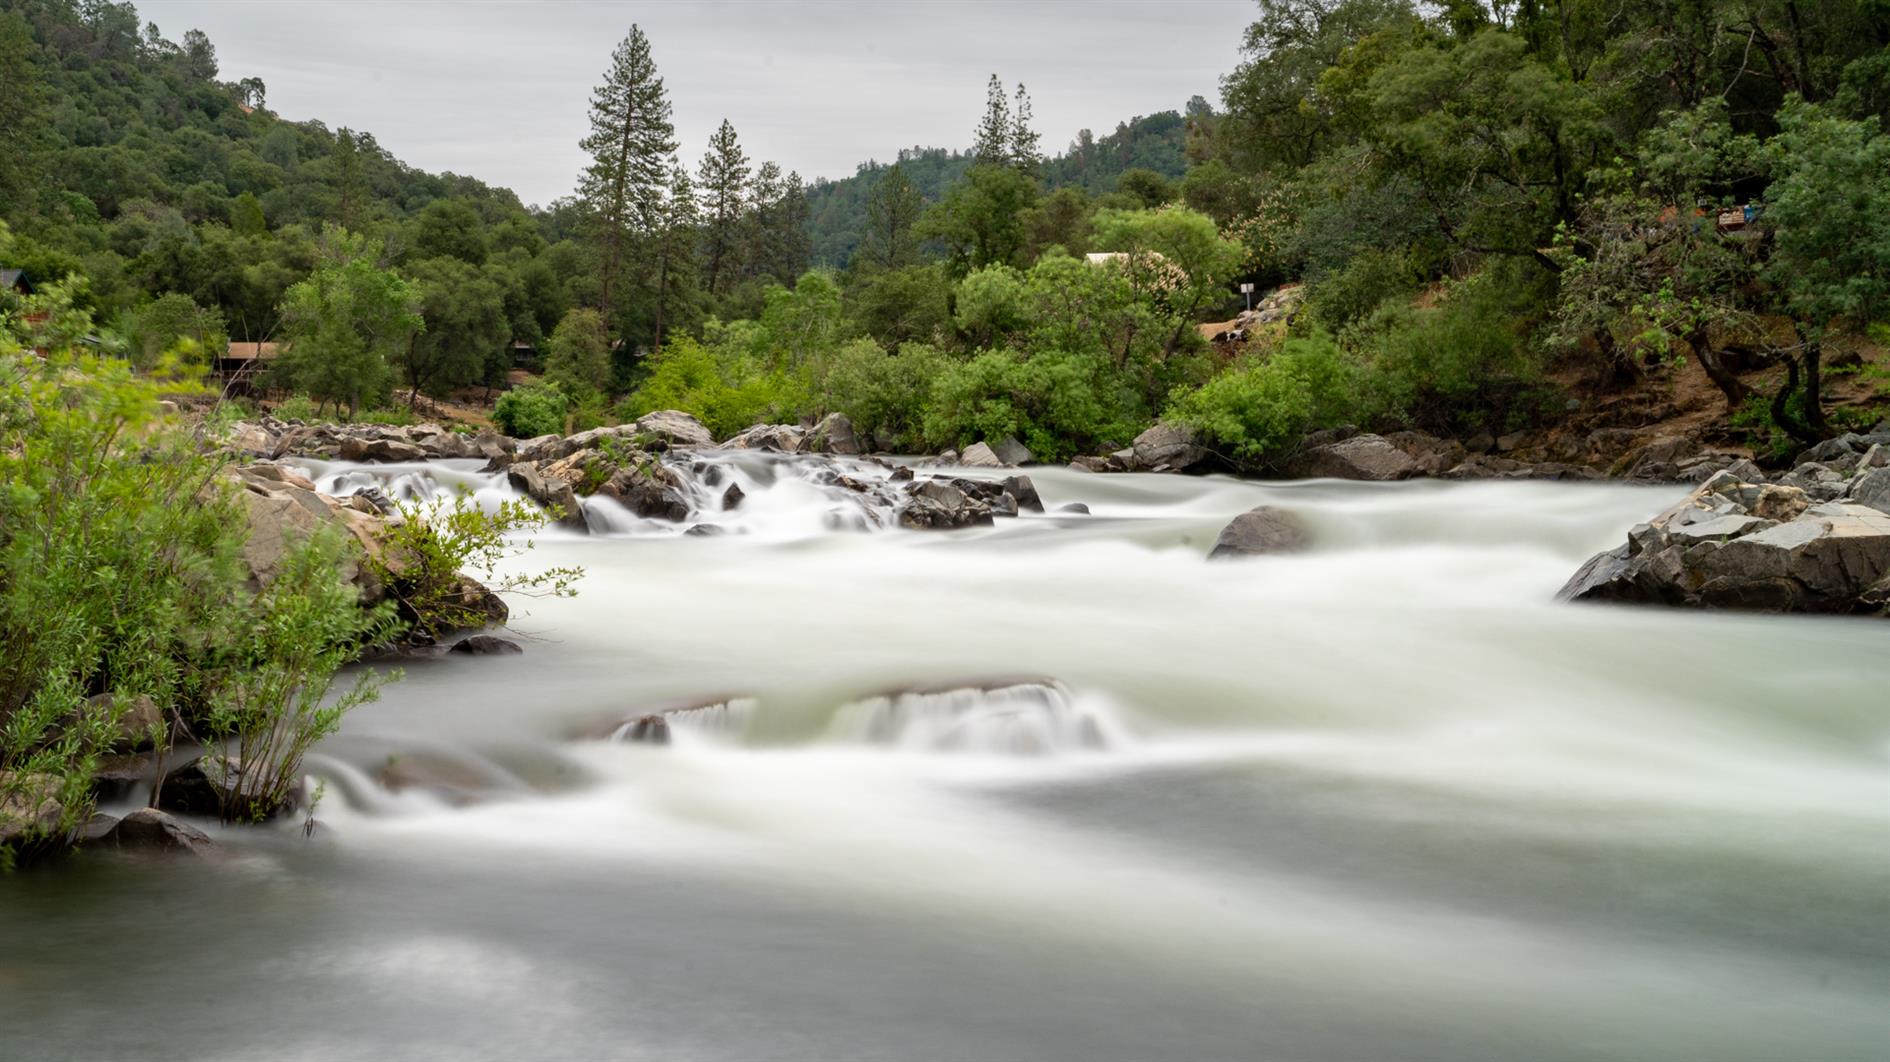
Rapids #photo#rapids Photo (long exposure) of rapids on the South Fork American River, Coloma, El Dorado County, California.)
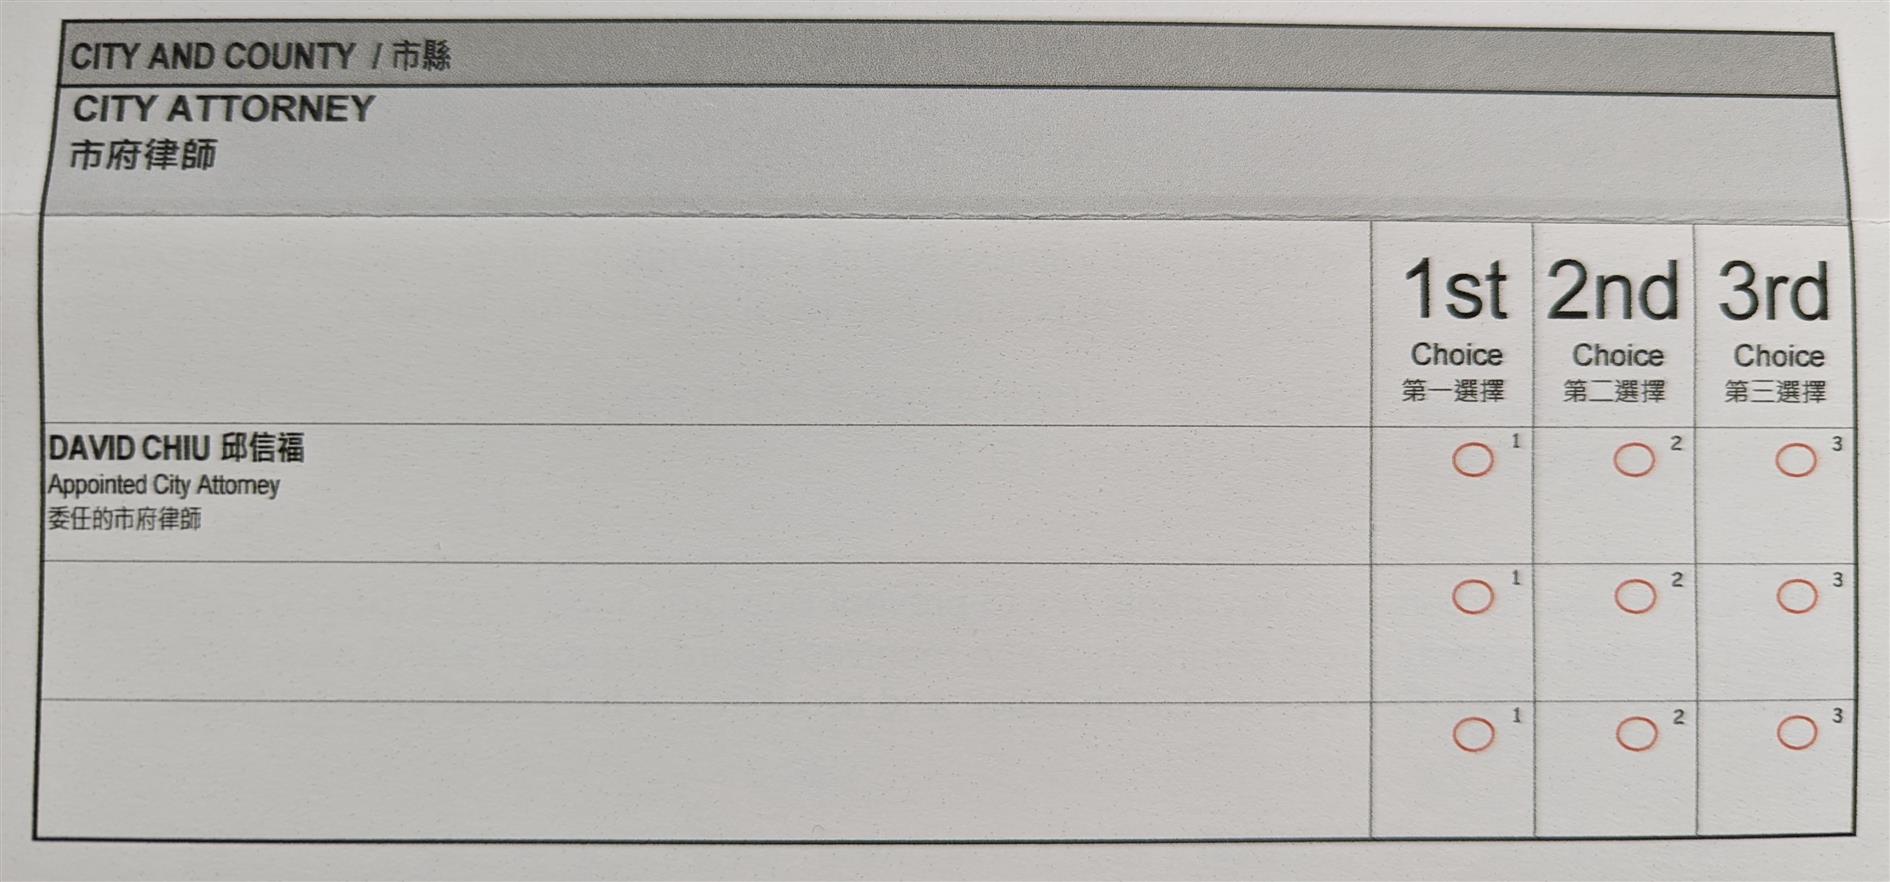
How I hate all the propositions. Here's the ITHCWY official (hastily scratched together and possibly idiotically wrong) voter's guide to the June 2022 batch:
A - MUNI Reliability and Street Safety Bond
Yes. I hate that the largest line item is bus yard upgrades rather than more frequent and reliable service but they make a good case for it - i.e. being able to repair broken equipment faster and not in a century old earthquake prone death trap of a building. Hopefully this is all true and they're not just installing hot tubs and keg fridges. But sure, MUNI, take my money.
B - Building Inspection Commission
Yes. Because it seems widely supported, not because I have a strong opinion here.
C - Recall Timelines and Vacancy Process
No. I hate recall elections (foreshadowing H below) but this is too restrictive. We shouldn't recall politicians for doing what they said they were going to do when we elected them. We should consider their performance when deciding if they deserve another term. But if they are egregiously bad it doesn't make sense to prevent the recall process for two full years, and I don't see any reason why an appointed successor shouldn't get a crack at the next election either.
D - Victims and Witness Rights
No. Creating a department for Victims is within the power of the city government. Doing this by ballot measure will mean they can't stop if it doesn't make sense or needs reform or turns out to be a bad idea.
E - Behested Payments
No. A majority vote of supervisors seems enough to modify the rules here.
F - Refuse Collection and Disposal
No. Replaces the City Controller with an appointed 'ratepayer representative' who is not really going to be able to represent all ratepayers. I think I'd rather stick with the Controller.
G - Public Health Emergency Leave
No. Sick leave should cover this and should be set at the state level. We don't need more businesses leaving San Francisco right now.
H - District Attorney
No. I don't think Boudin has done anything that rises to the level of recall, and he should be judged at the next election. He's unlucky enough to be holding the hat during a post-pandemic crime surge, but mostly it's a surge back to pre-pandemic levels. Murder is up, but is everywhere. I generally support locking fewer people up and a consequence of this is more unlocked up people. Hard to see how you can have this both ways. The fentanyl situation in the city is a tragedy. I don't think recalling Boudin fixes this. I think we need legalized, safe, tested drugs and treatment rather than criminalization.
You are not my Senator, however despite the 'all men are created equal' concept your vote is more than 20 times more powerful than the Senators who do represent me. I therefore feel compelled to write and ask you to reconsider your position against ending the filibuster.
In The Hill this week you are quoted as saying:
"You all know where I stand; I’ll do anything I can."
But then, unfortunately:
"The filibuster is the only thing that prevents us from total insanity. Total insanity."
I believe that you hold this position out of principle. I also know that you have previously worked (and failed) to strengthen background checks. We can't make any progress solving this problem without you. Please take an evidence based approach to the actual danger involved in allowing the Senate to legislate with a simple majority. Consider as a starting point the rest of the G-7.
Canada only requires a supermajority to pass a constitutional amendment. Those trucker protests got a little out of hand, but Canada is not insane.
France does not require a supermajority. It is not insane.
Germany does not require a supermajority. It is not insane.
Italy uses a supermajority for early rounds of presidential voting but otherwise not. Also not insane.
Japan needs a supermajority to amend their constitution. Again, not insane.
I'm not in love with the House of Lords, but the United Kingdom manages to pass laws without a supermajority and is not insane.
Our inability to control gun violence and our inability to allow the duly elected government to legislate are the same problem. Insanity is doing the same thing (in this case nothing) over and over again and expecting different results.
(Published to the Fediverse as:
I would do anything to reduce gun violence, but I won't do that (an open letter to Joe Manchin) #politics#senate#filibuster#guns An open letter to Senator Joe Manchin on ending the filibuster in the U.S. Senate so that we can control guns.)
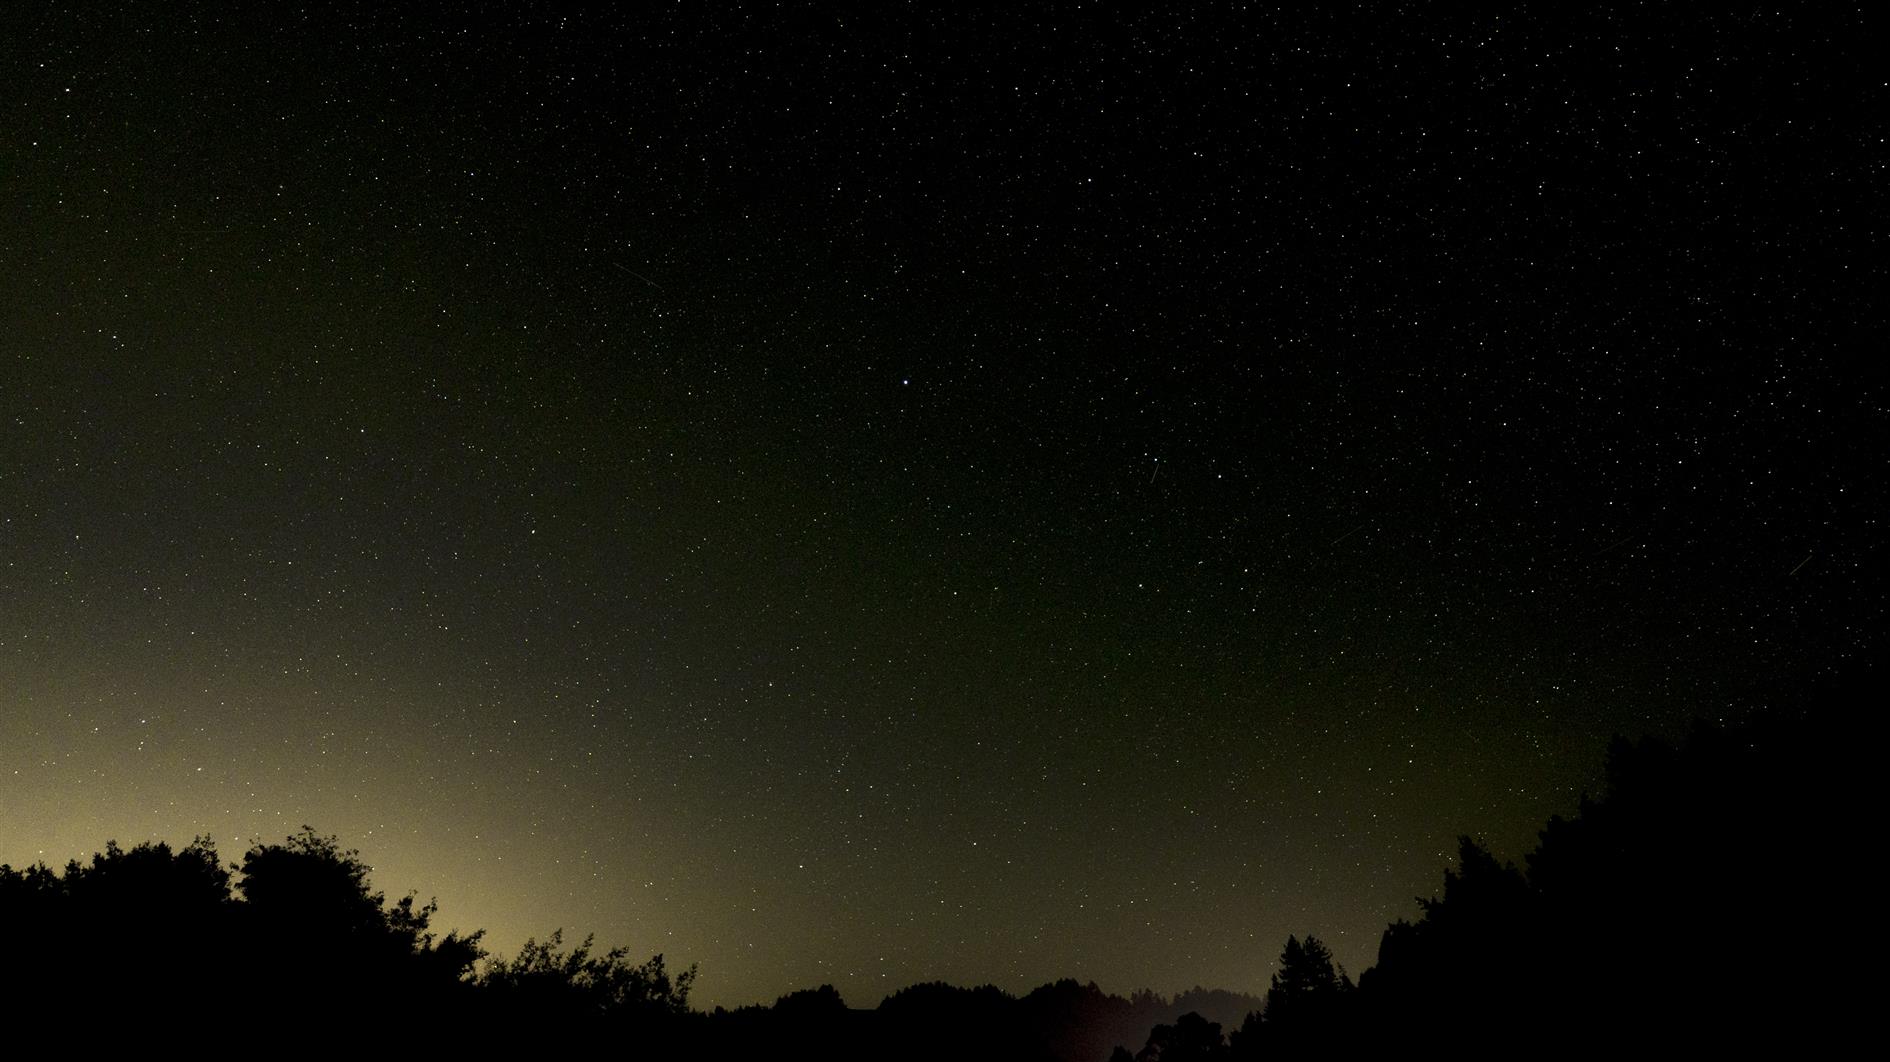
Timelapse of stars over Casini Ranch, a campground near Duncan Mills in Sonoma, California. Shot over two nights looking north-east and then south-west from the bank of the Russian River.
(Published to the Fediverse as:
Stars over Casini Ranch, a Timelapse #timelapse#video#stars 4k time lapse of stars over Casini Ranch on Duncan Mills, Sonoma, California. Shot next to the Russian River over two nights.)