Visualizing Coronavirus Cases and Deaths by Country and US County
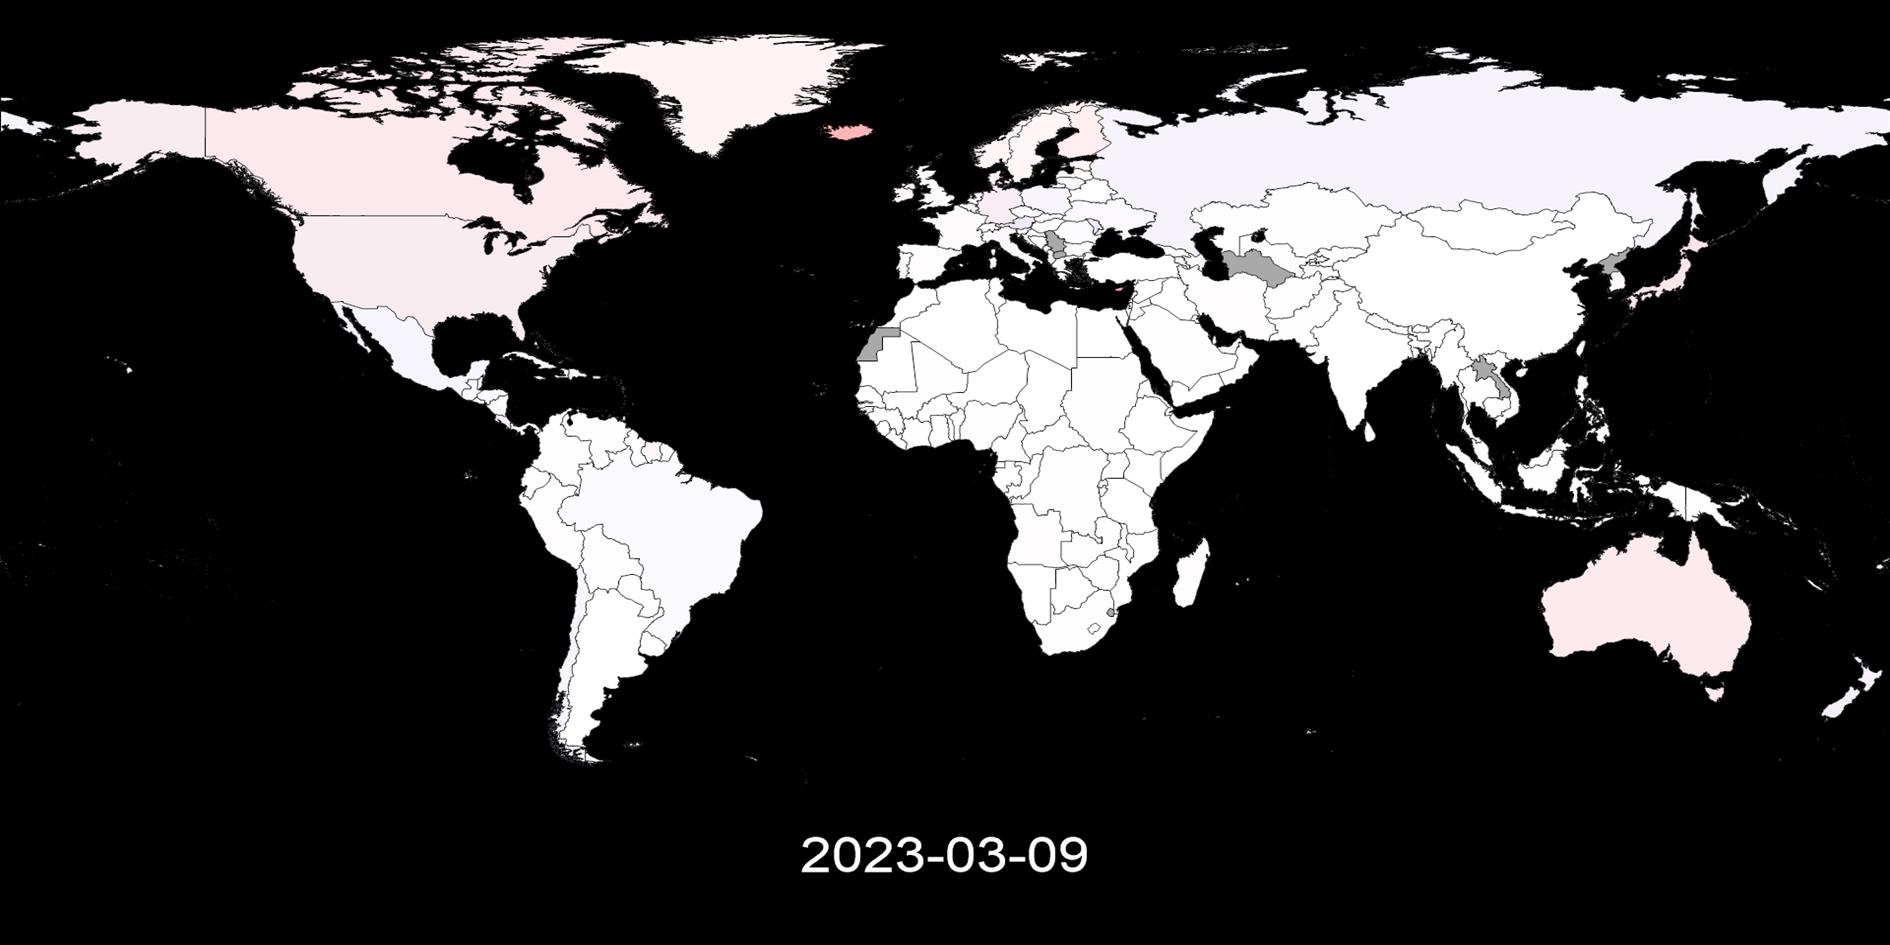
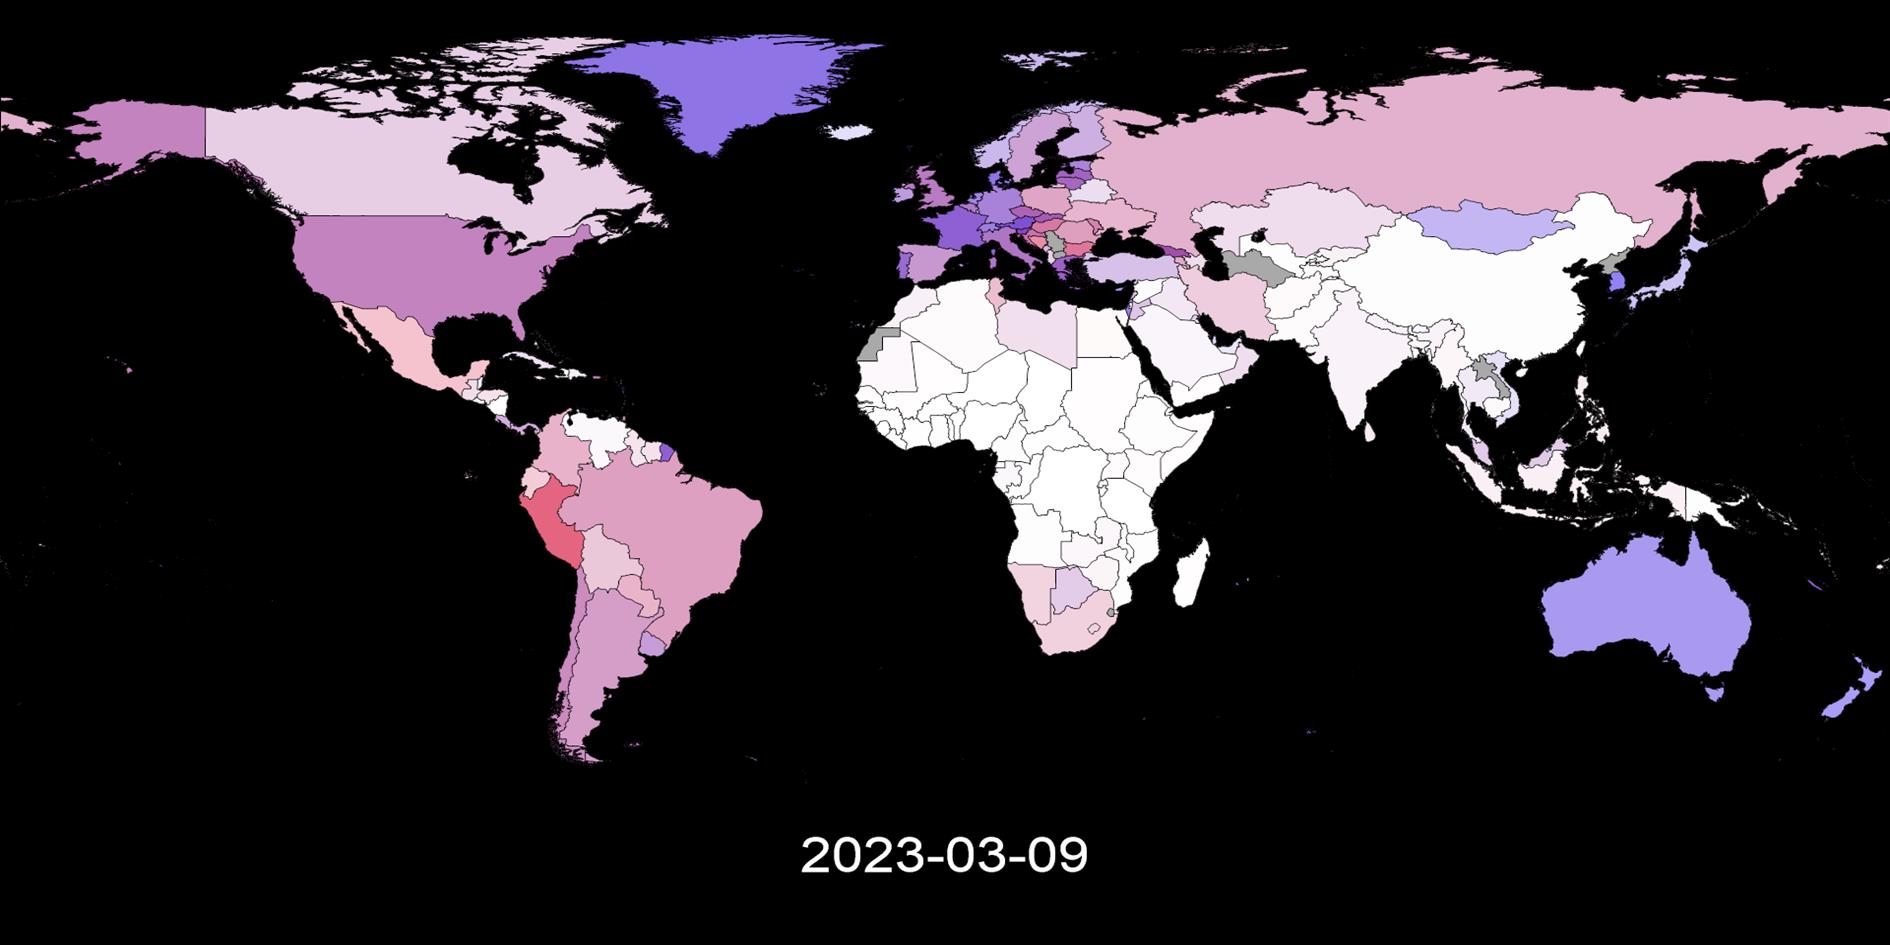
Cases and Deaths by Country
Week on Week Incremental
Cumulative
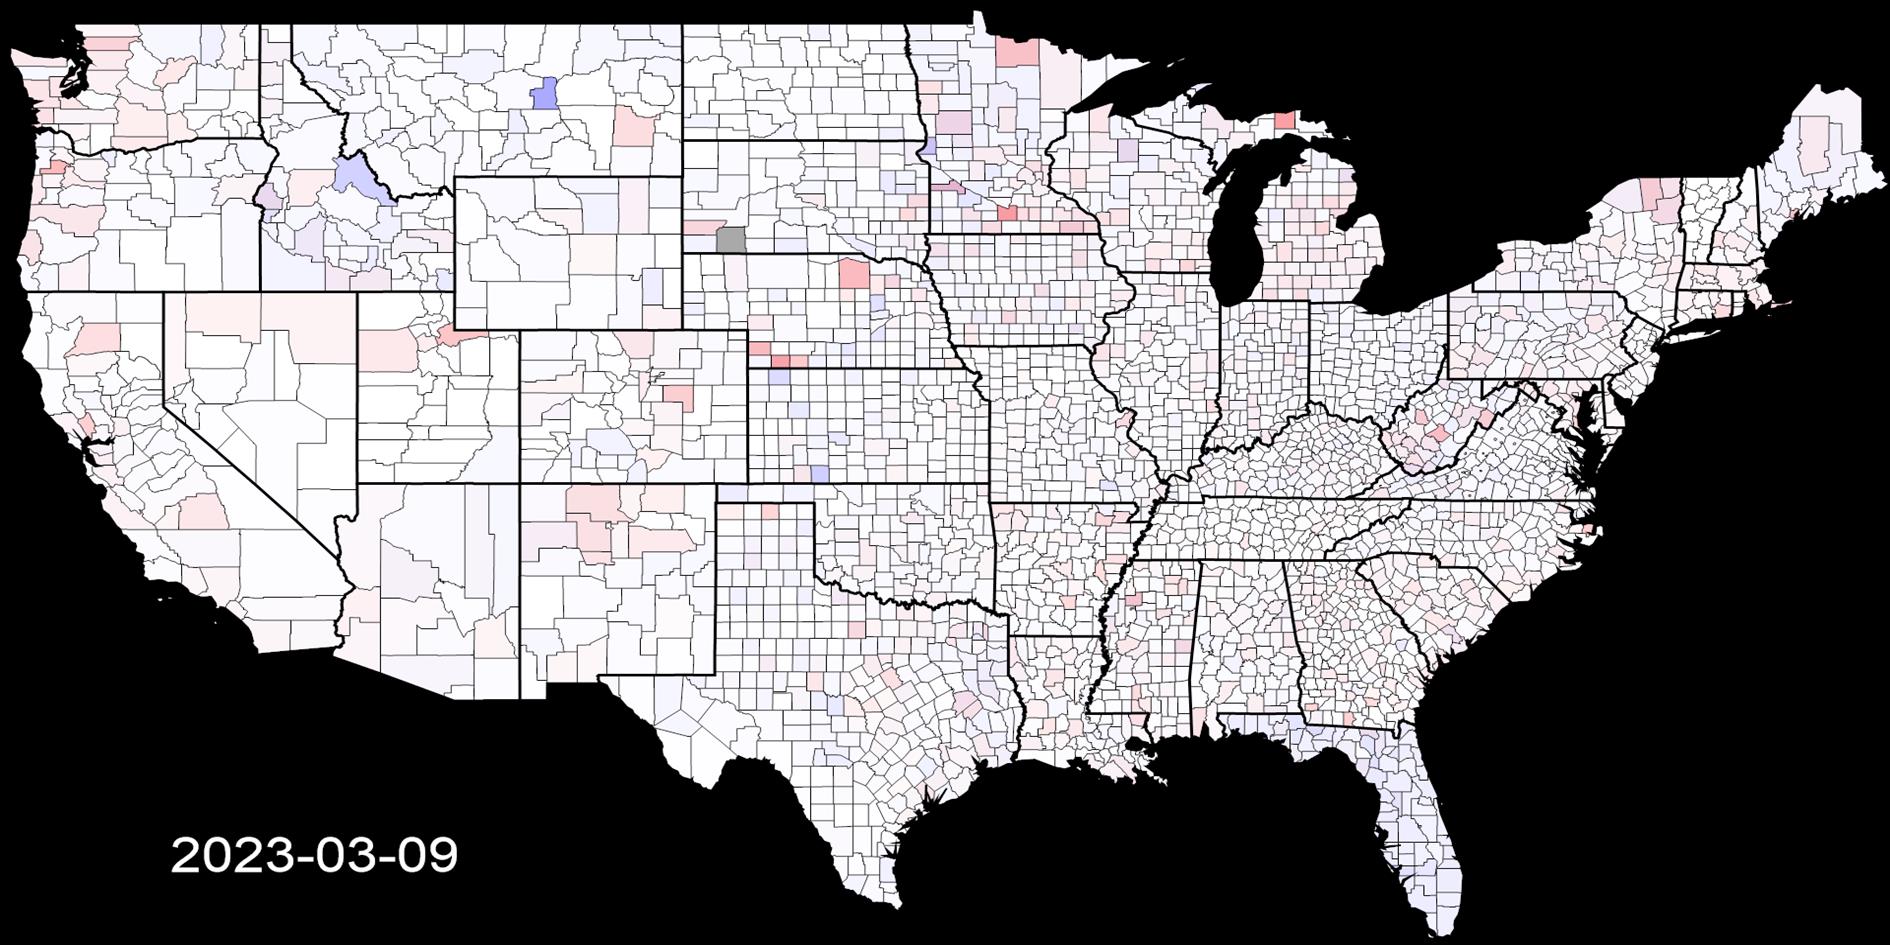
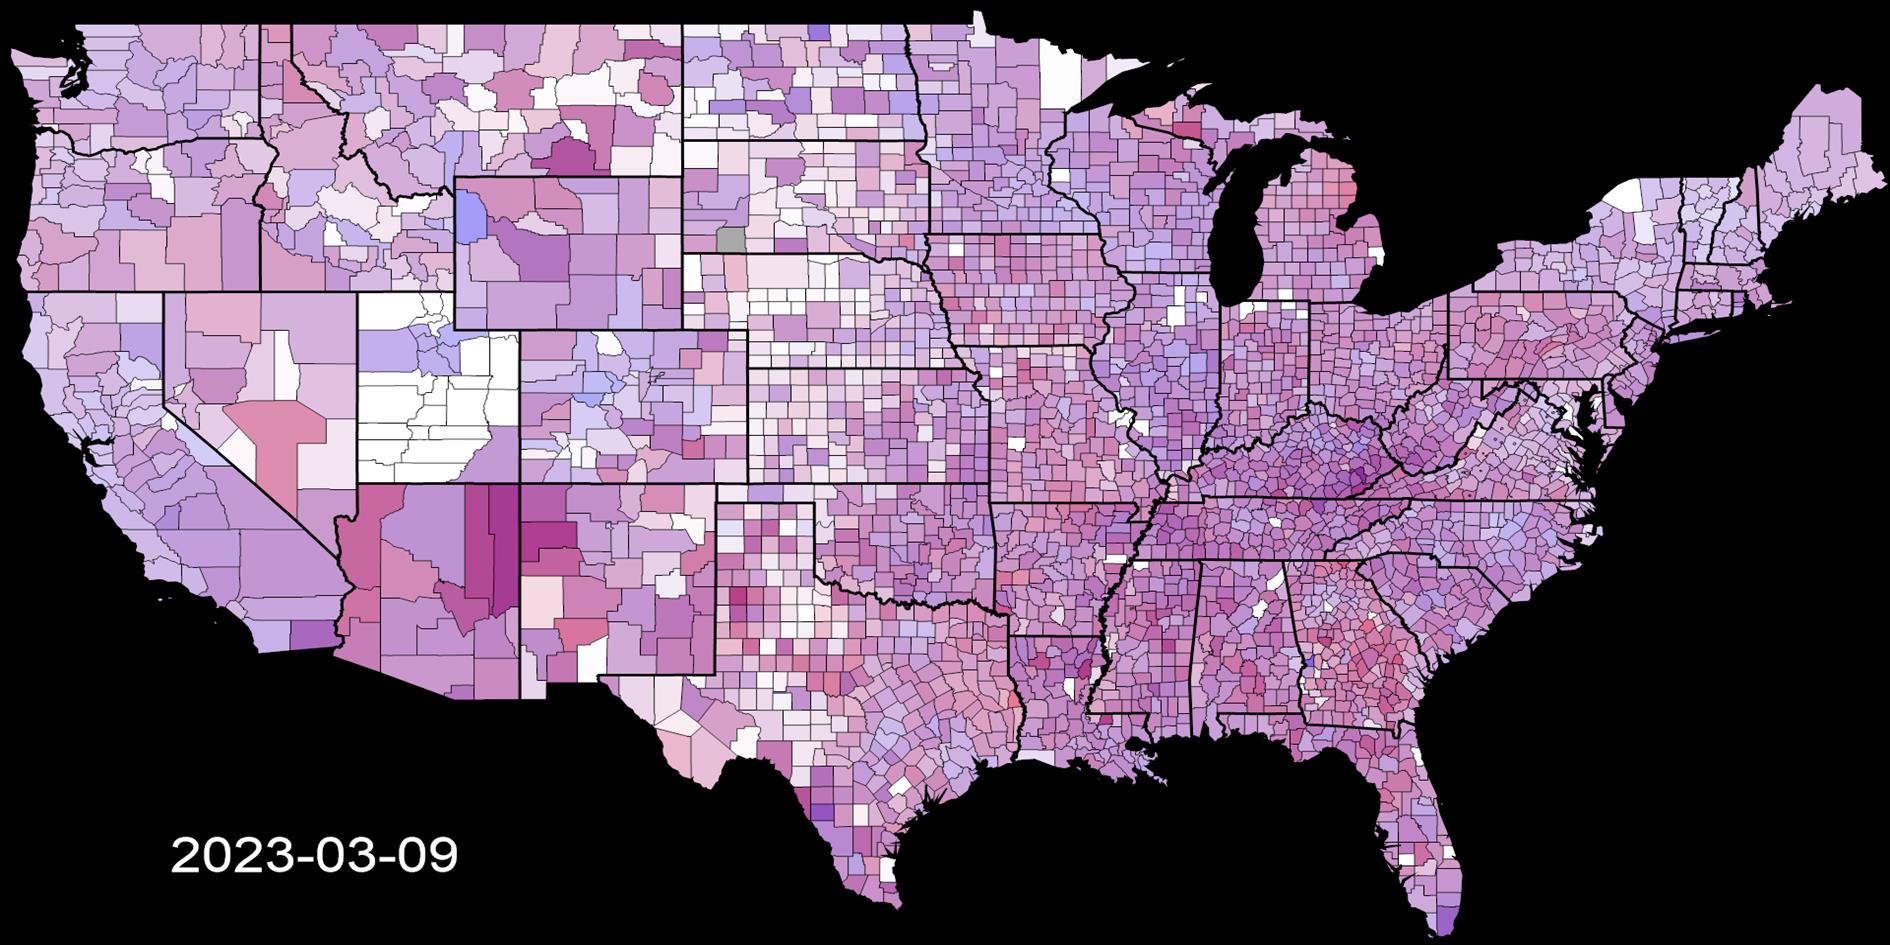
Cases and Deaths by US County
Week on Week Incremental
Cumulative
This post visualizes global and US county level coronavirus data from Johns Hopkins University. Four videos show both cumulative and week on week progression (comparing seven day moving averages) of the disease together with four images that show the most recent snapshot. It used to be updated weekly, this stopped August 5, 2023.
Cases and deaths are shown simultaneously using blue for cases and red for deaths. Where both are high a region will be a shade of purple. Regions with no data are dark gray.
The week on week incremental visualization is useful to see the history and current state of the spread of coronavirus. Each region is shaded based on the highest number of daily cases and deaths for that region and is relative to population. For example if the highest number of deaths reported on any day in San Francisco county is seven, then any day that has seven deaths will be the brightest shade of red. This shows where COVID-19 is relatively bad over time.
The cumulative visualization is shaded relative to the highest total death and case count for any region, relative to population.
As the location and date of the peak in week on week and cumulative cases and deaths change over time the videos will be different each time you watch. Bookmark this post and check back for weekly updates.
(This is the fifth version of this post as I have changed the data source and methodology several times. I usually preserve the previous version of any post but the changes are large enough that in this case I have removed them).
Cases and Deaths by Country
Week on Week Incremental
Cumulative
Cases and Deaths by US County
Week on Week Incremental
Cumulative
Add Comment
All comments are moderated. Your email address is used to display a Gravatar and optionally for notification of new comments and to sign up for the newsletter.