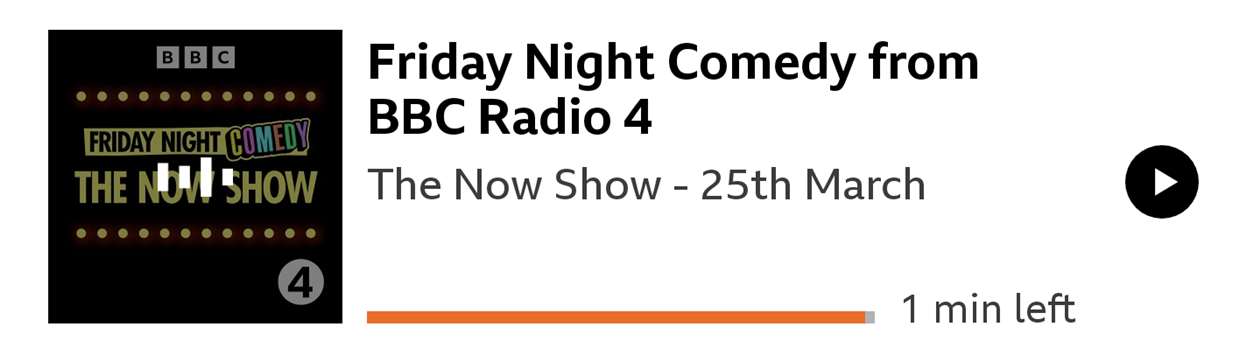
I just want to listen to Friday Night Comedy on Radio 4.
It used to be the case that this was safely subscribed in my podcast app (I use Podkicker Pro) and so each new episode would download to my feed when released.
The BBC has decided to fix the problem of me getting the program I want to listen to automatically and conveniently. If I want my comedy I have to install My Sounds. When Spotify tried this with Science Vs I just stopped listening. I have plenty of other science podcasts but The Now Show and the News Quiz are irreplaceable. So maybe I could cope with one walled garden.
My Sounds says it will notify you when new episodes are available. It does not.
My Sounds has a My Sounds tab which lists Latest programs. I'm writing this on April 2 and the most recent episode of Friday Night Comedy is from March 25.
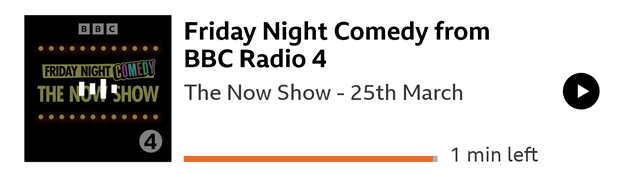
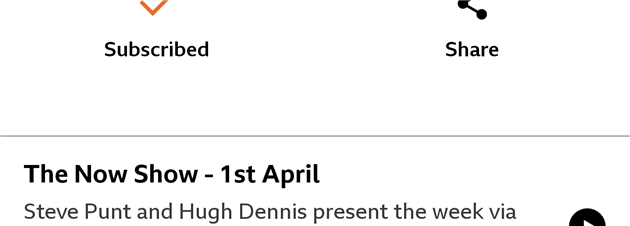
Only if I go into Subscribed, and then the program page for Friday Night Comedy does it finally admit that there is an episode from April 1.
So I'm forced to install an app that not only fails to notify me of new episodes of subscribed programs but actively hides them in the basement behind a beware of the leopard sign. BBC, maybe get the app working before forcing me into it? I would rather pay to subscribe to an RSS feed than deal with My Sounds.
I'd take the time to leave a one star review, but in its infinite wisdom Google doesn't allow paying customers to leave app reviews.
Updated 2022-05-06 11:32:
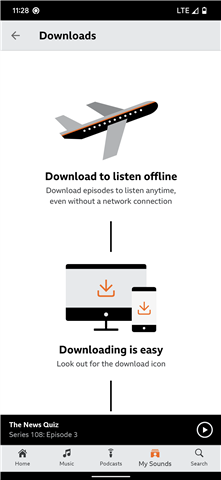
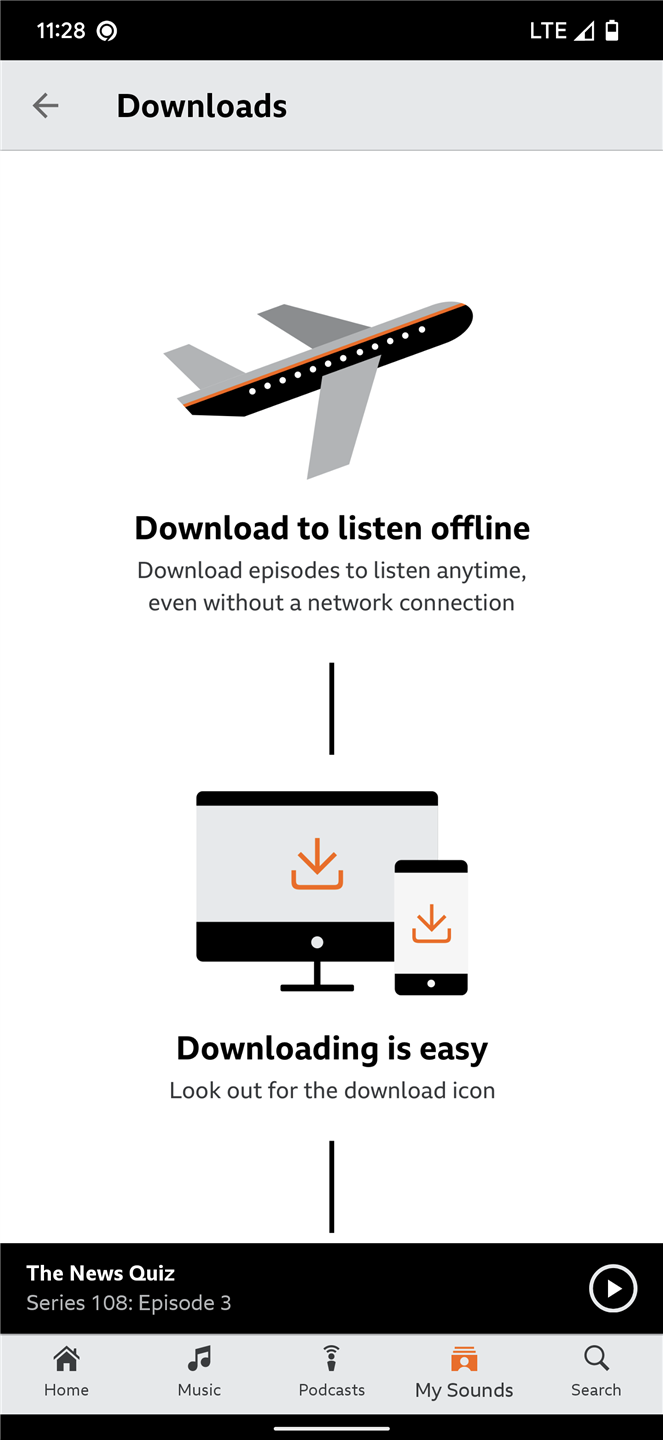
Having been forced into the excreable BBC My Sounds at least it supports downloading an episode to listen to on the plane right?
Updated 2022-05-06 11:33:
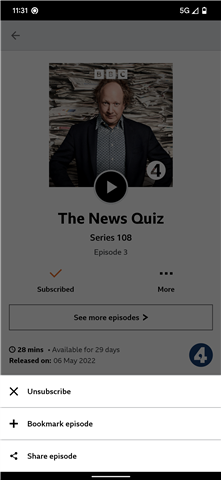
Does it fuck. BBC, please fix this and then try asking nicely?