Age and Life Expectancy Weighted Voting
Youth turnout for elections is famously dismal. In 2016 less than half of 18-29 year-olds voted, compared to over two thirds as you get to 45 and older (US Census). The impact is an incentive to cater to the old - trying to make America great again (like you remember from when you were young) vs doing something about climate change or house prices.
One fix is compulsory voting, like in Australia. I'm not sure I want to force people without an opinion to vote though.
What if we just weighted votes by the total size of the demographic group?
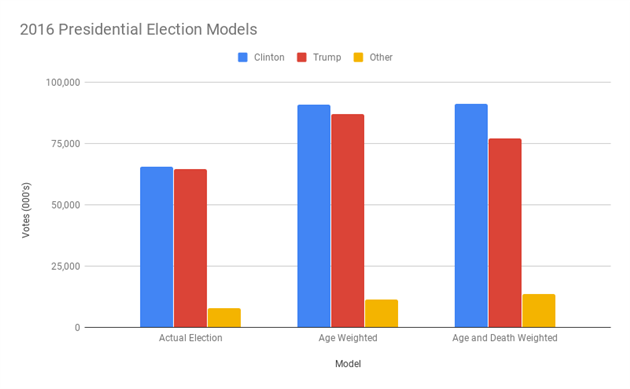
I took the demographic breakdown of 2016 voters from the US Census Bureau and multiplied these by the age breakdown from CNN exit polls. This gave Clinton a lead of just under a million votes - somewhat lower than the actual result. This is likely a polling error in the exit poll, but it's a reasonable baseline with Clinton beating Trump in the popular vote by 48% to 47%.
To age weight the result I just applied the exit poll percentages to the total population in each age bracket - i.e. what would have happened if everyone in each age group voted the same way as their peers. This obviously increases the size of the electorate so absolute numbers are less interesting. Clinton now beats Trump 48% to 46%, possibly enough to reverse the electoral college outcome (I haven't attempted this projection state by state).
Making up for poor turnout is an interesting adjustment, but what about life expectancy? All of those baby boomers have plenty of free time to vote but are not going to be around to die of obscure tropical diseases in the Minnesotan jungle. So I also weighted each population segment by life expectancy (18-29 year-olds are going to be around for another 55 years, 65+ more like 7). Clinton now has a majority instead of a plurality - she beats Trump 50% to 42%.
All three models are shown in terms of total votes counted in the chart above.

Add Comment
All comments are moderated. Your email address is used to display a Gravatar and optionally for notification of new comments and to sign up for the newsletter.