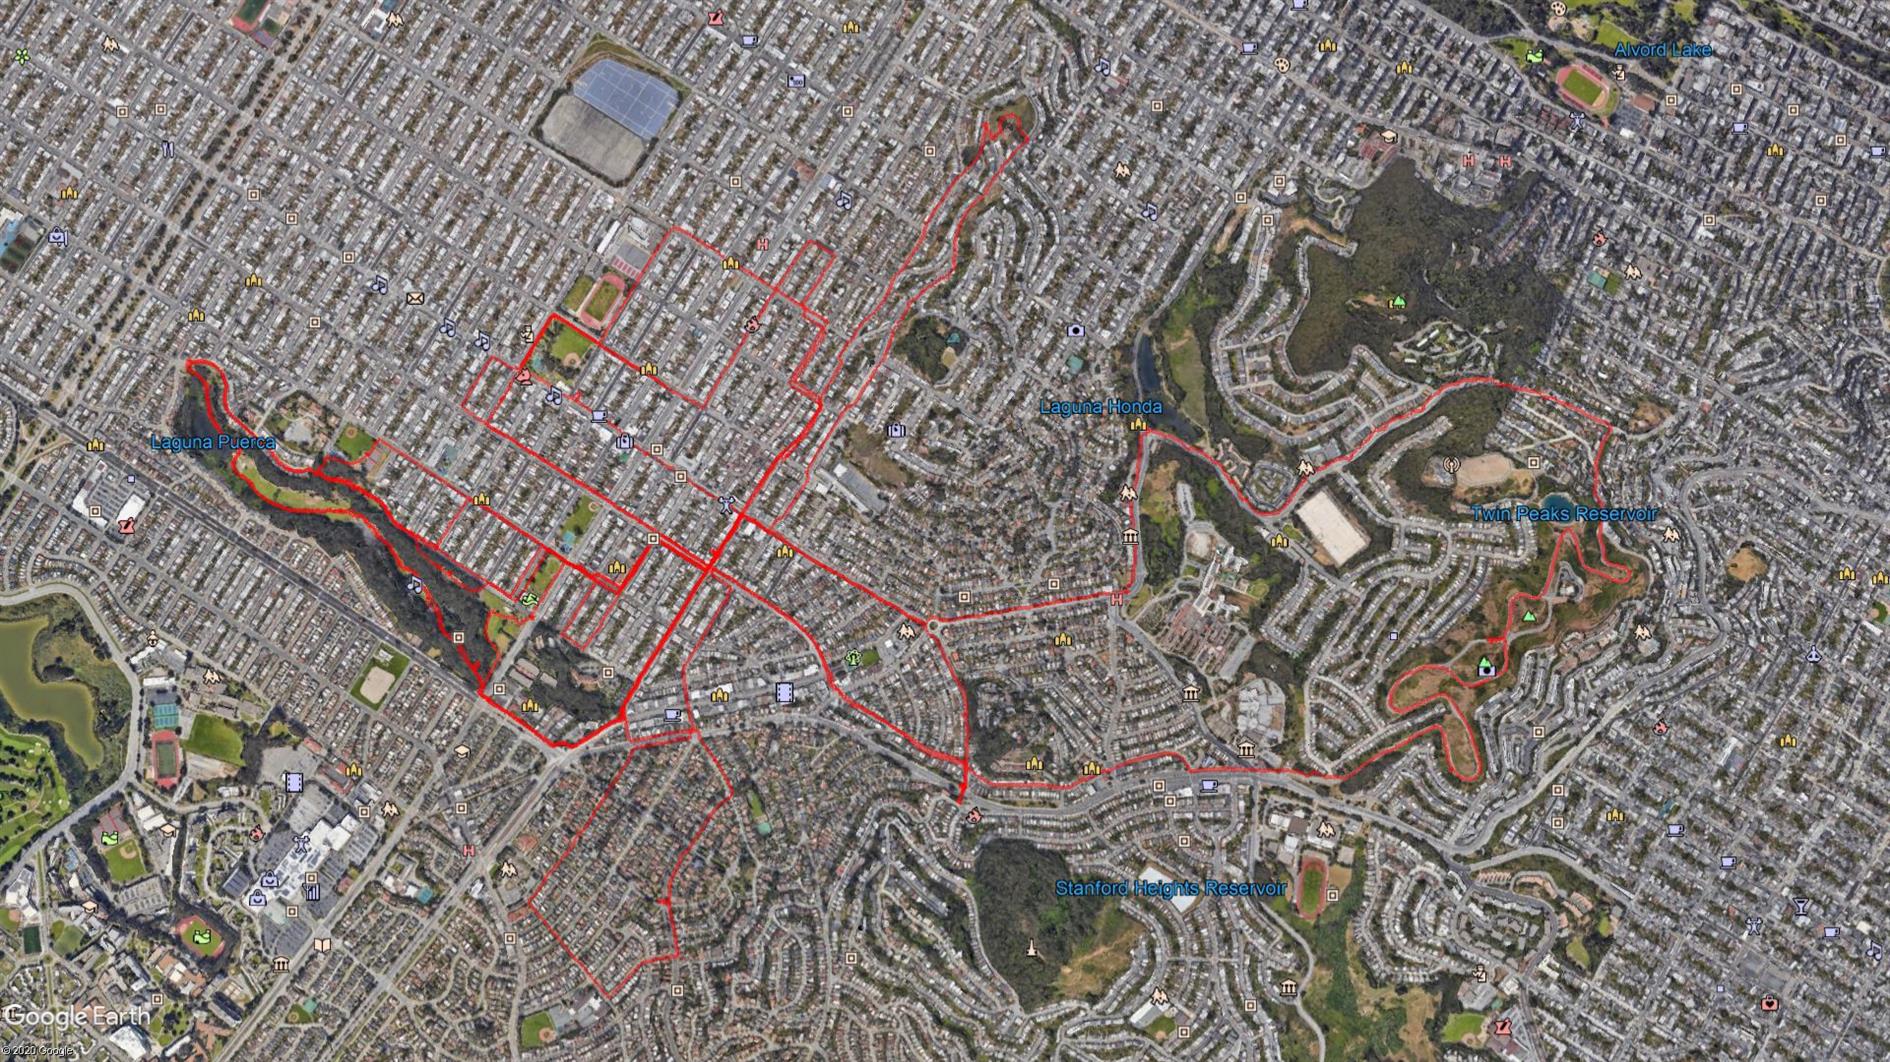
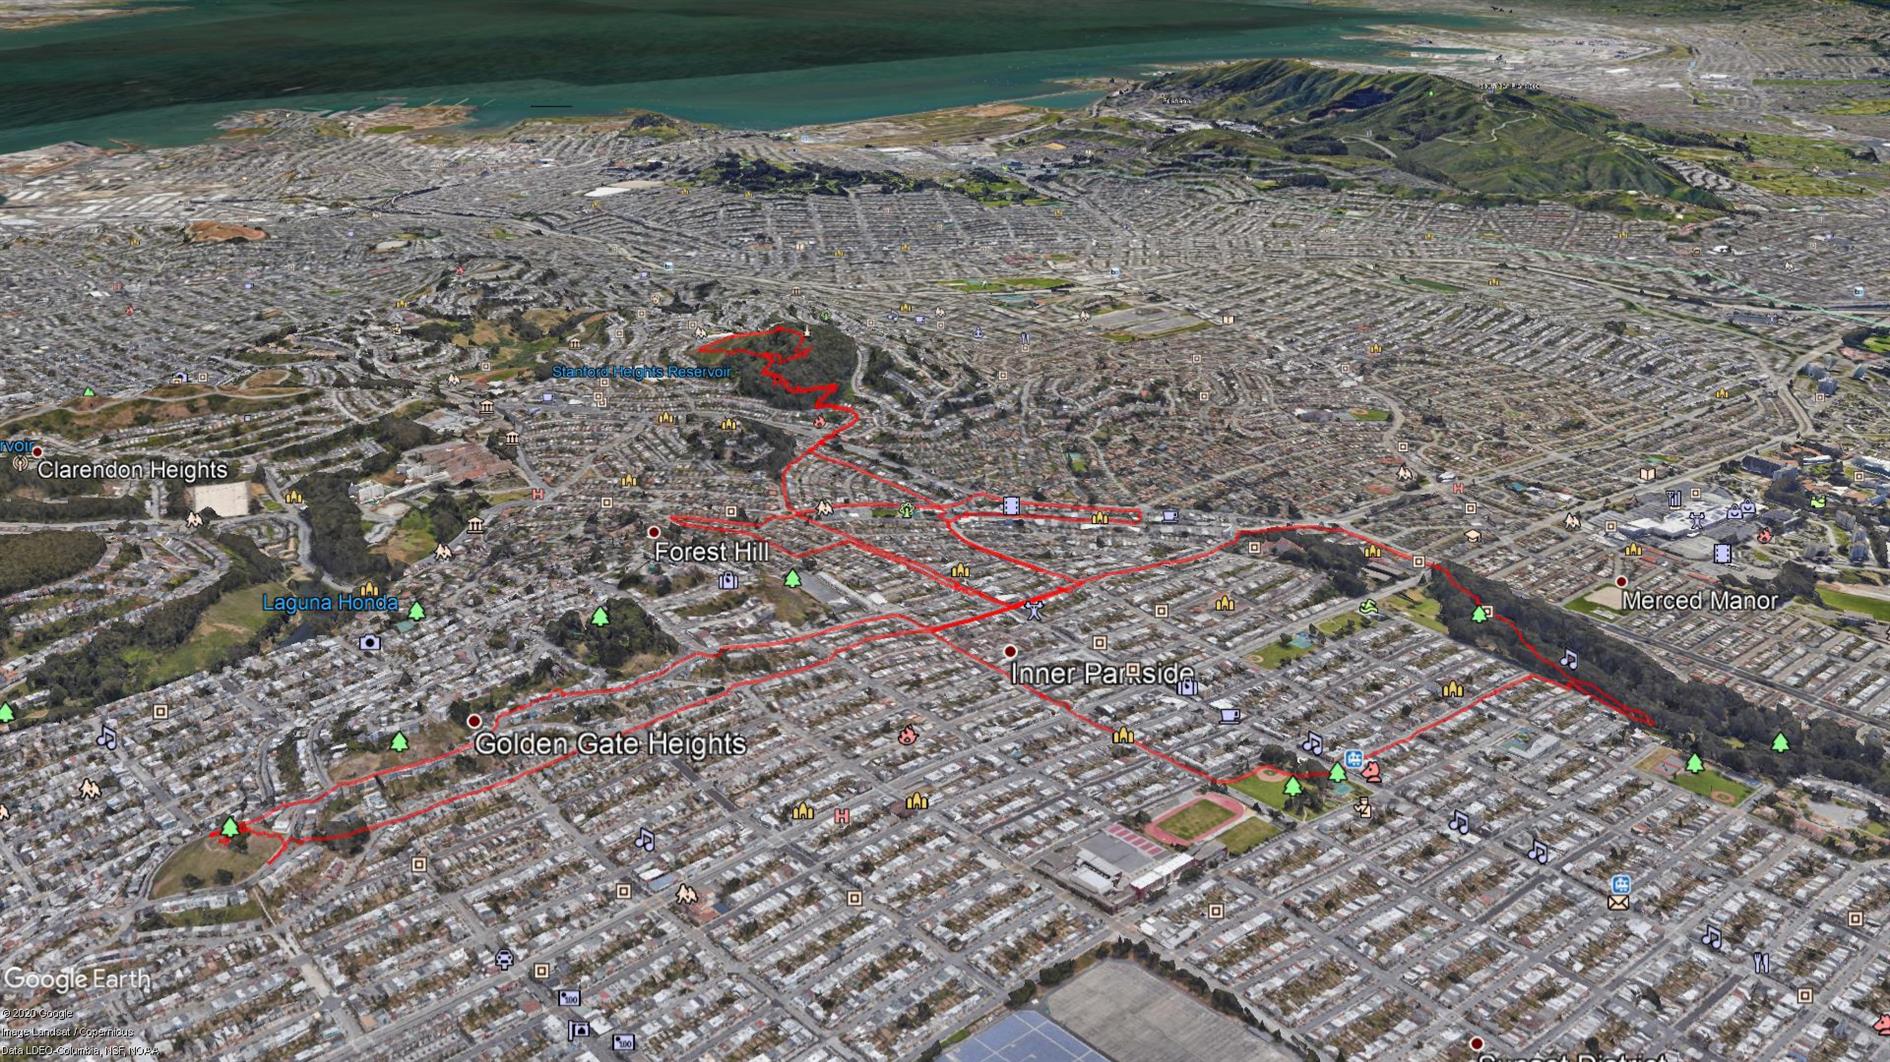
Coronavirus Hikes: July 2020
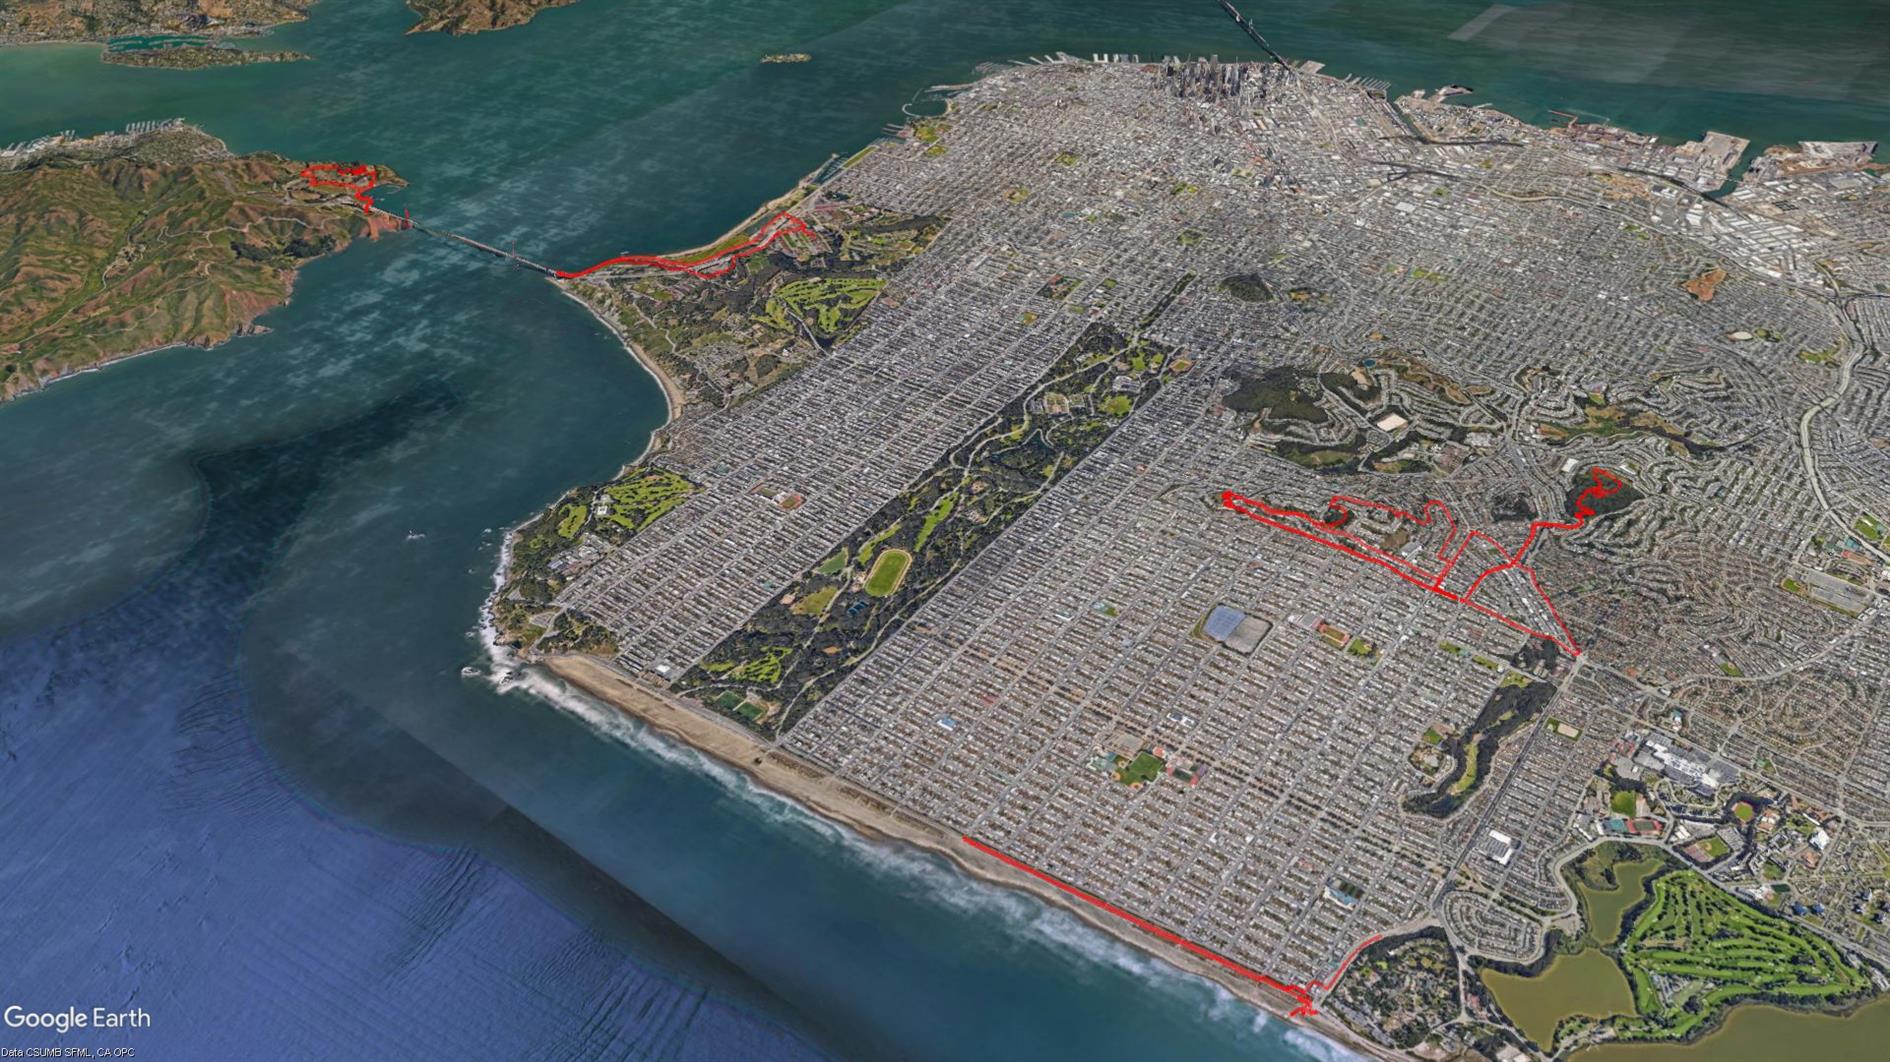
Hike starts at: 37.742189, -122.471394. View in Google Earth.
Related Posts
- Coronavirus Hikes: May 2020
- Coronavirus Hikes: Done
- Coronavirus Hikes: June 2020
- Coronavirus Hikes: April 2020
- Coronavirus Hikes: March 2020
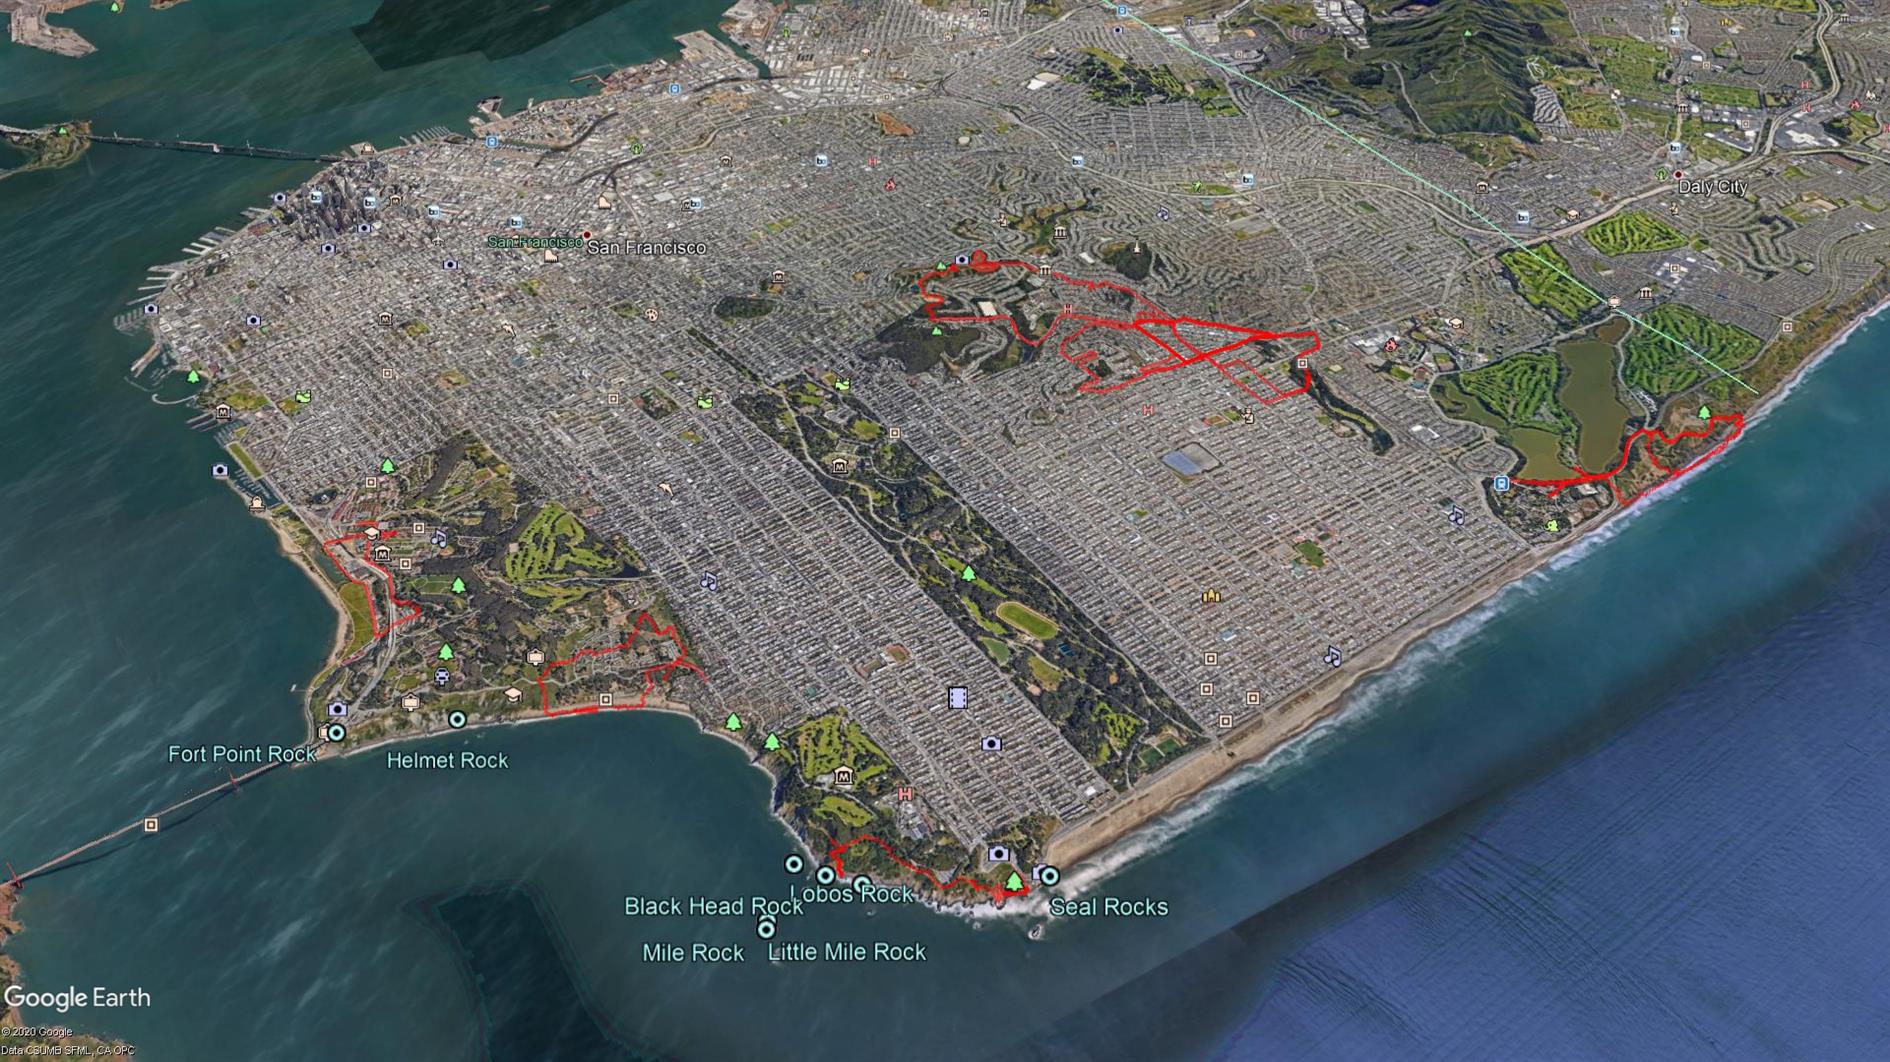
(Hike Map)
(Published to the Fediverse as: Coronavirus Hikes: July 2020 #hike #coronavirus #map Lockdown hikes around San Francisco for July 2020. )
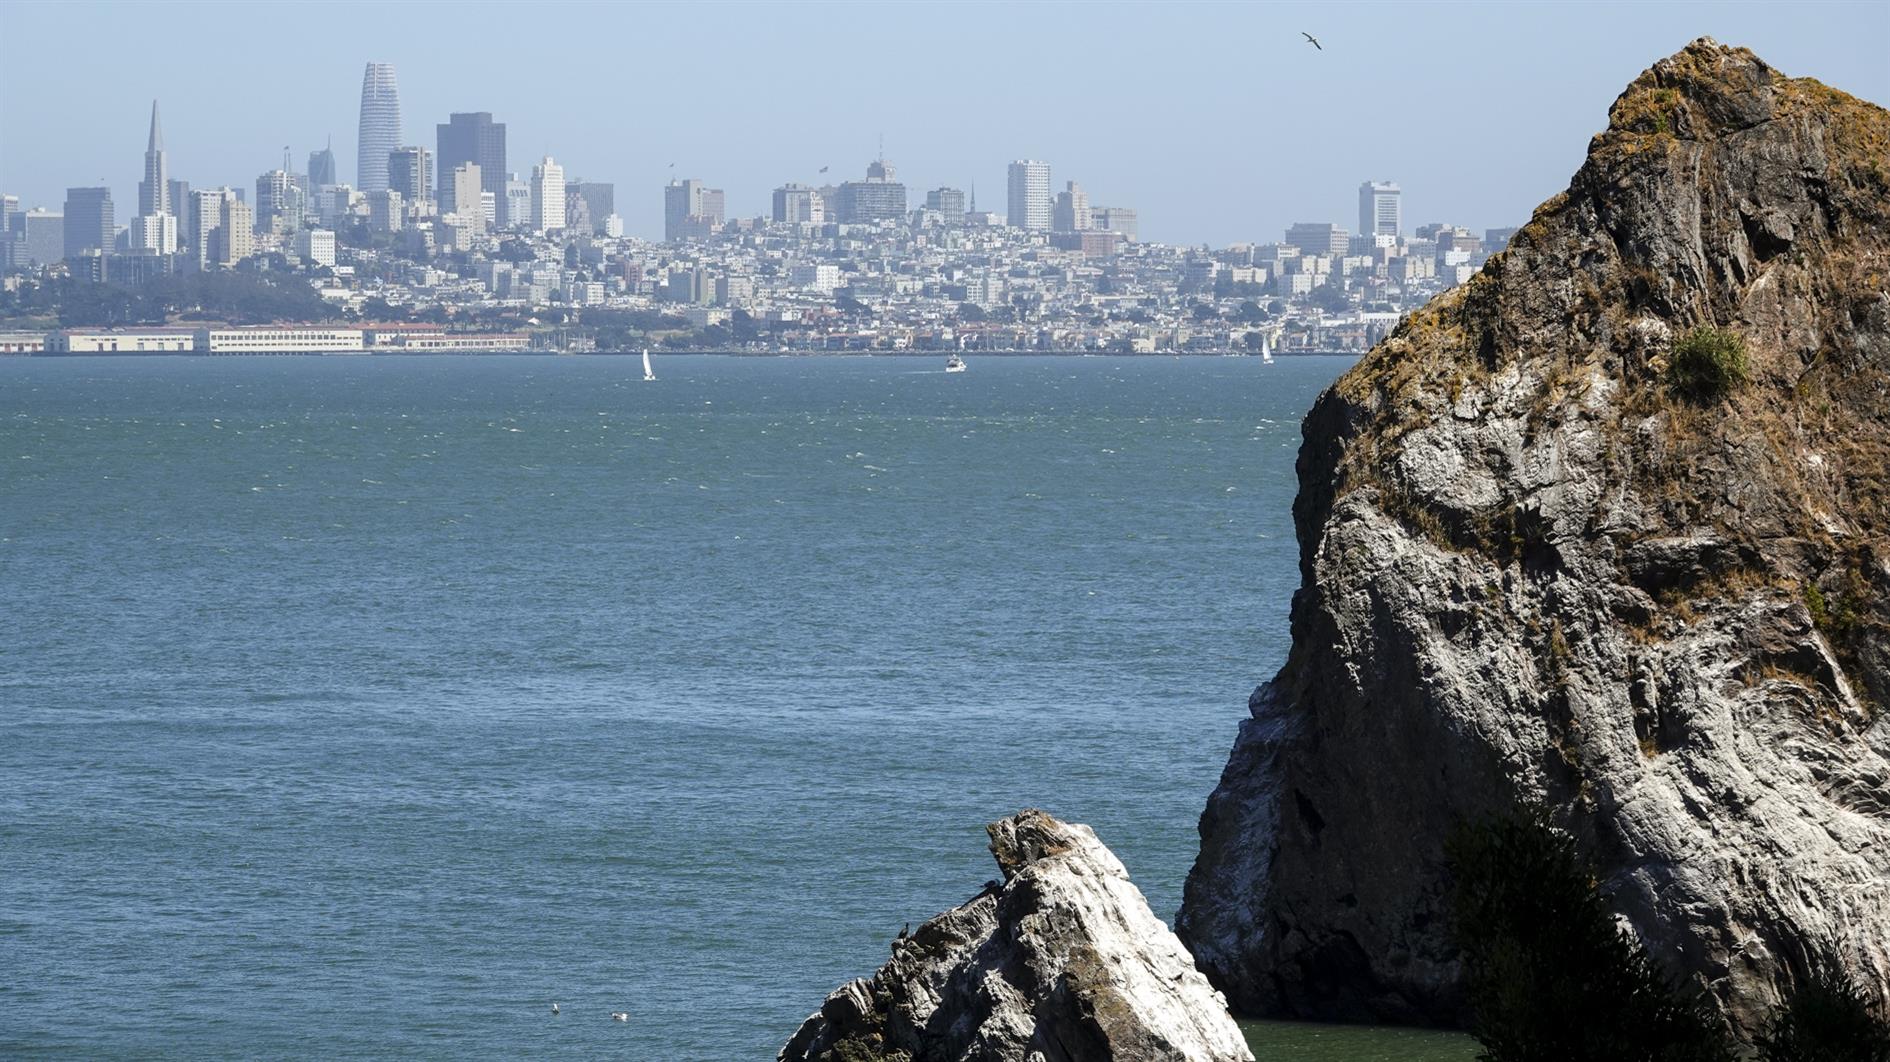
Coronavirus Hikes: June 2020
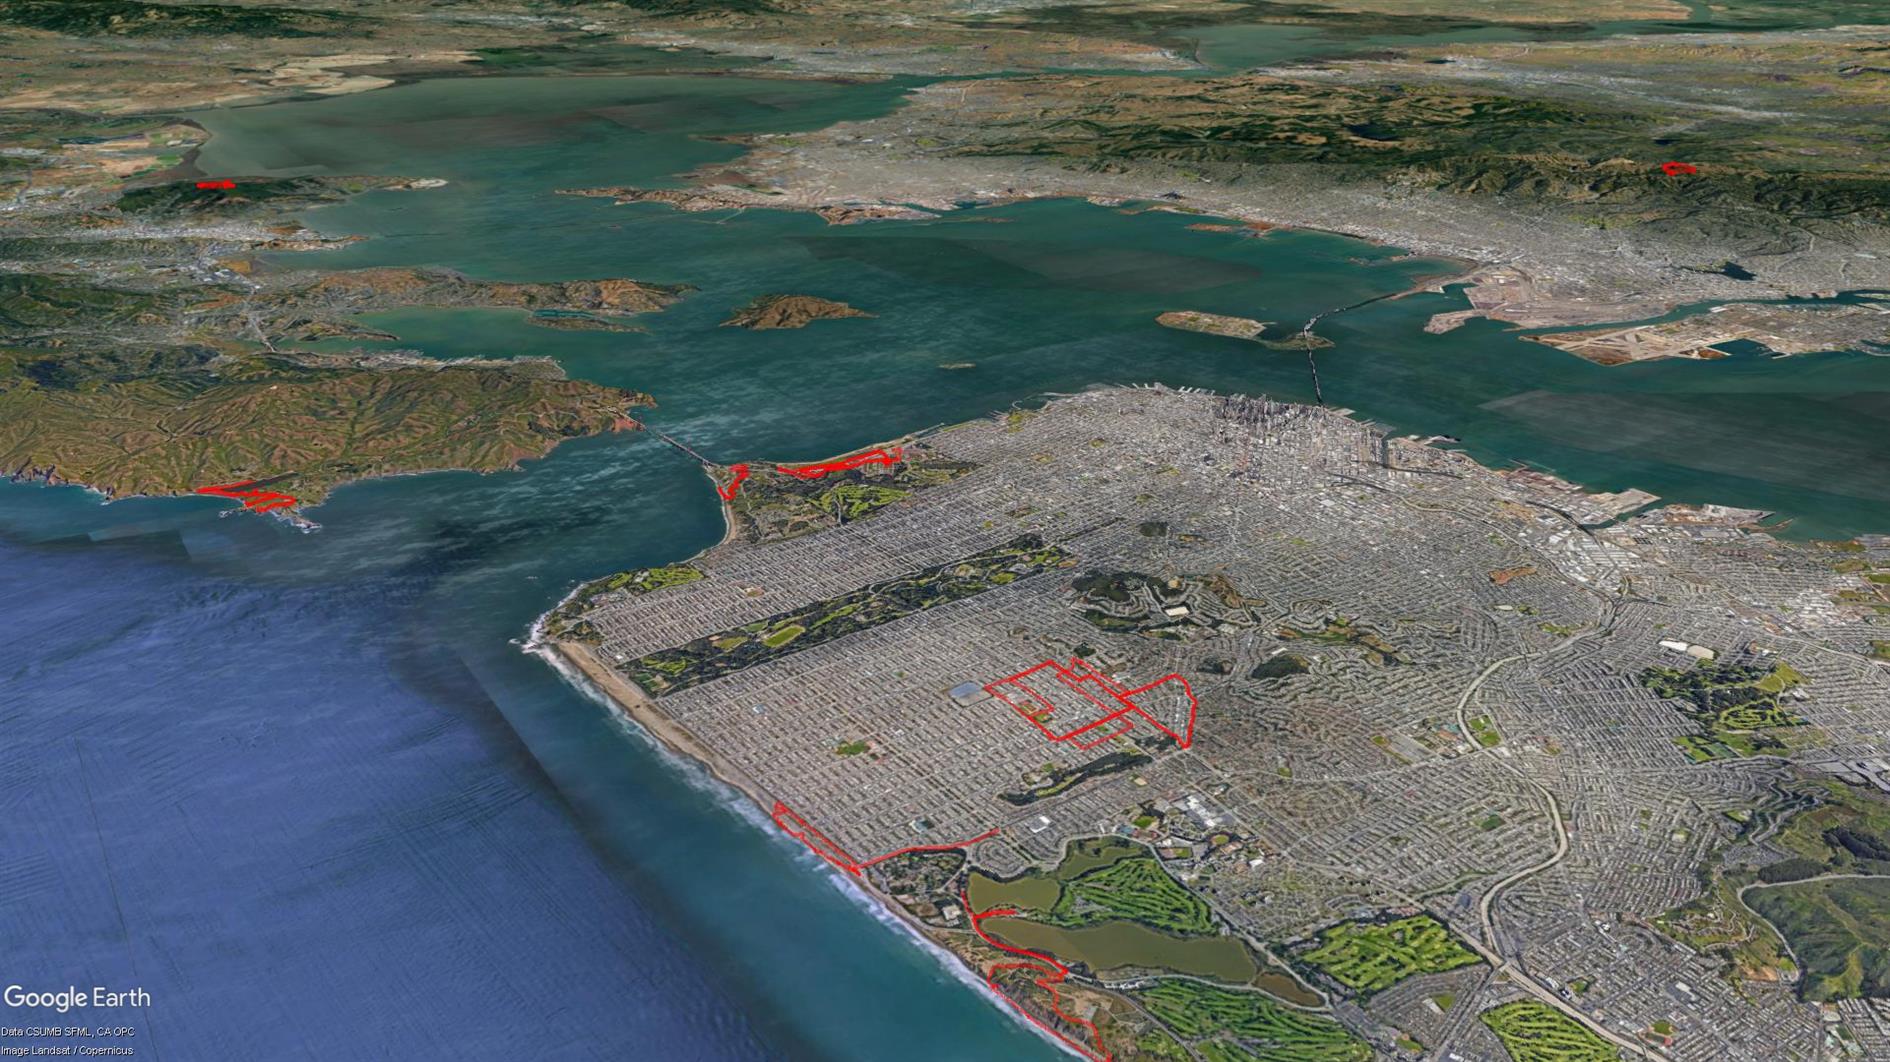

Starting to leave San Francisco. Photo is of Bird Island in the Marin Headlands. 39.1 unique miles.
Hike starts at: 37.741862, -122.471579. View in Google Earth.
Related Posts
- Coronavirus Hikes: May 2020
- Coronavirus Hikes: April 2020
- Coronavirus Hikes: July 2020
- Coronavirus Hikes: March 2020
- Coronavirus Hikes: Done
(Hike Map)
(Published to the Fediverse as: Coronavirus Hikes: June 2020 #hike #coronavirus #map Lockdown hikes around San Francisco for June 2020. )
Visualizing Coronavirus Cases and Deaths by Country and US County
Cases and Deaths by Country
Week on Week Incremental
Cumulative
Cases and Deaths by US County
Week on Week Incremental
Cumulative
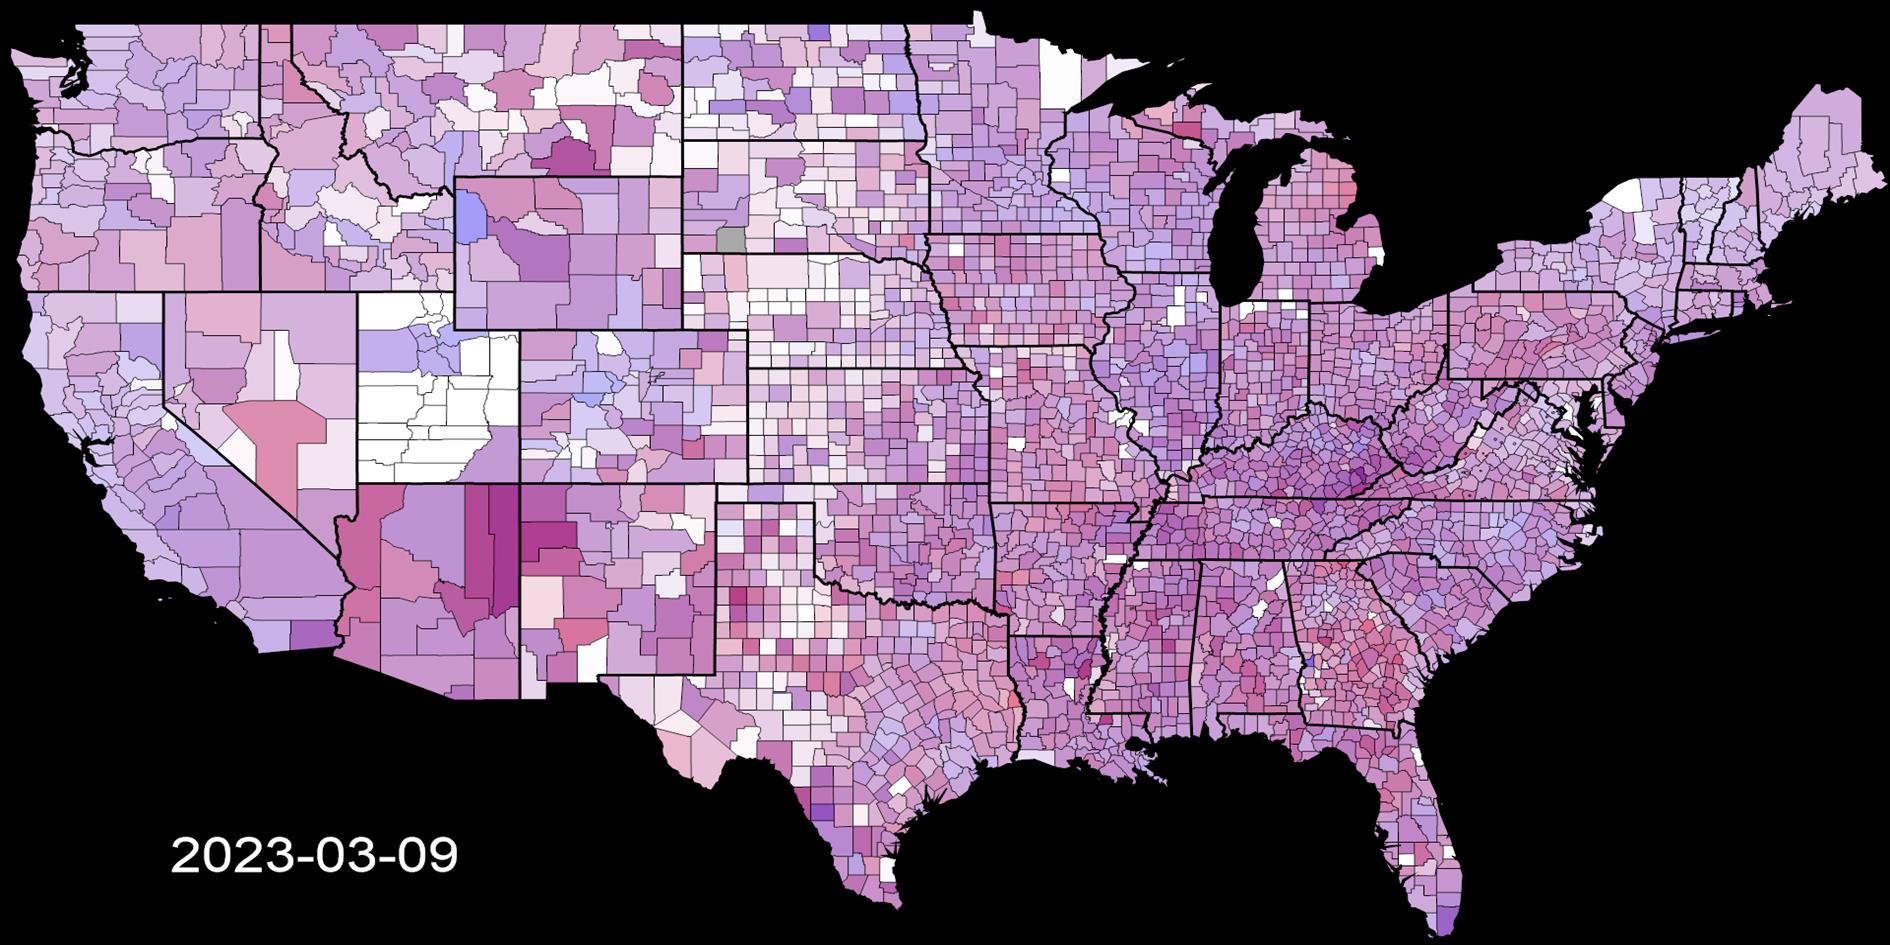
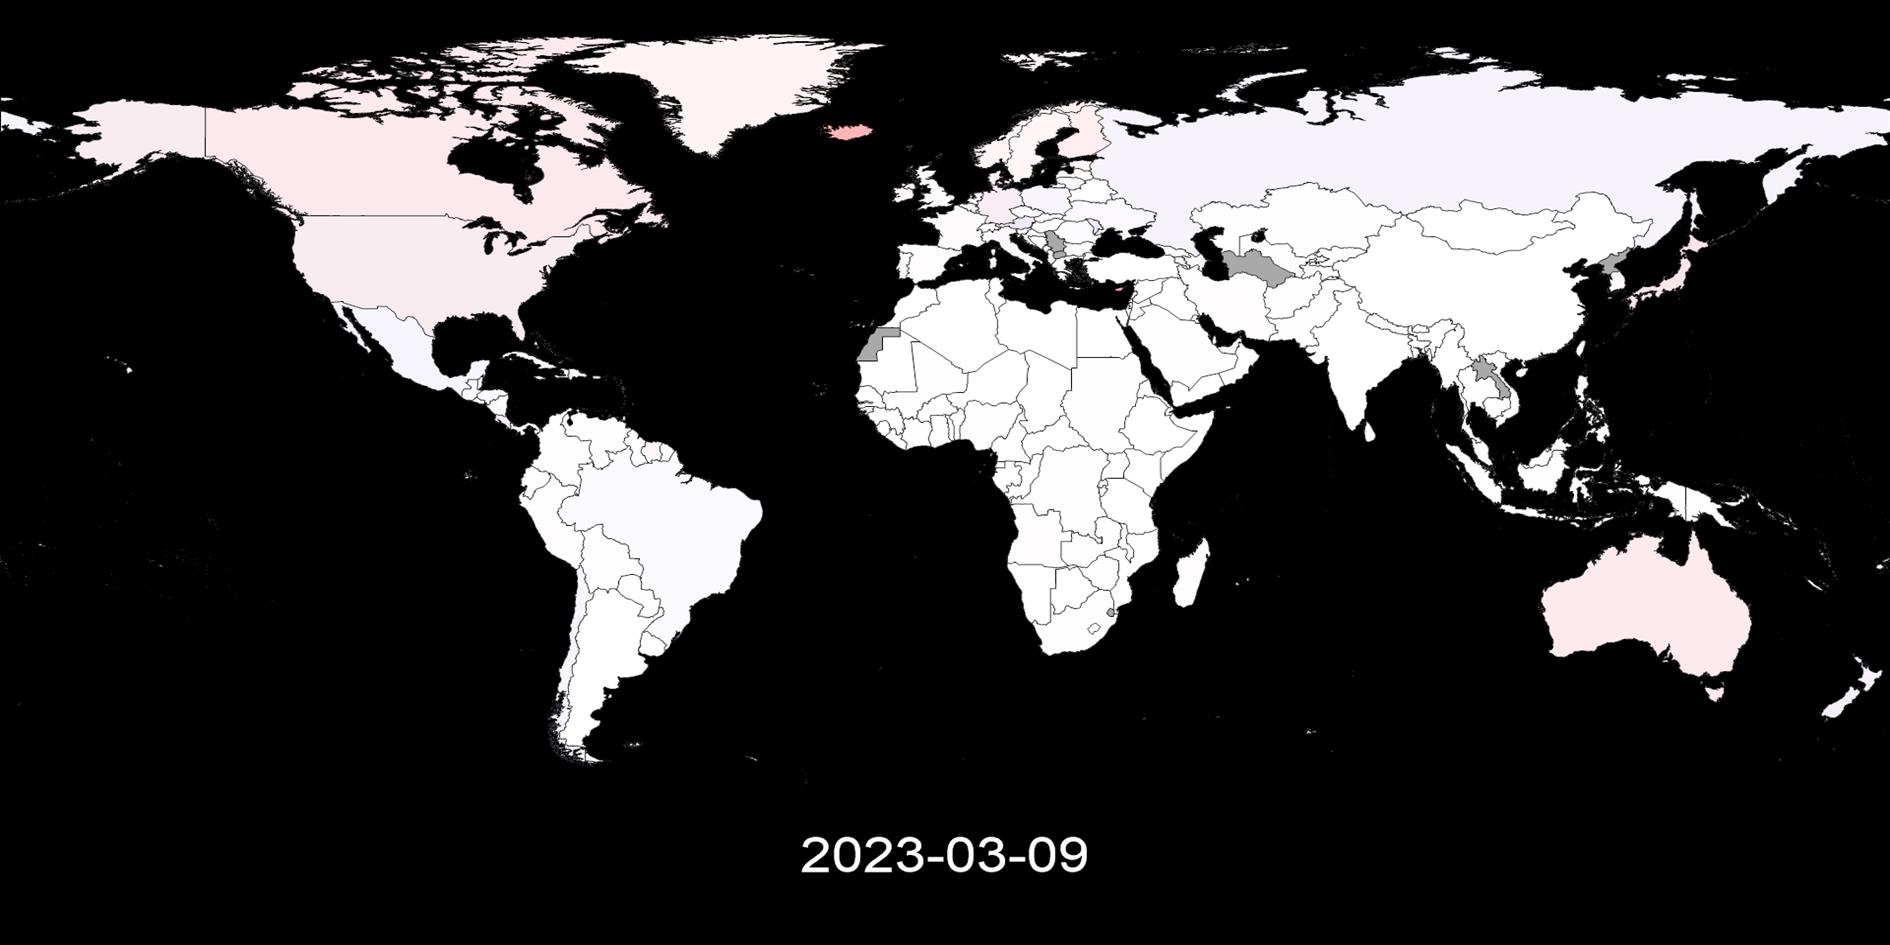
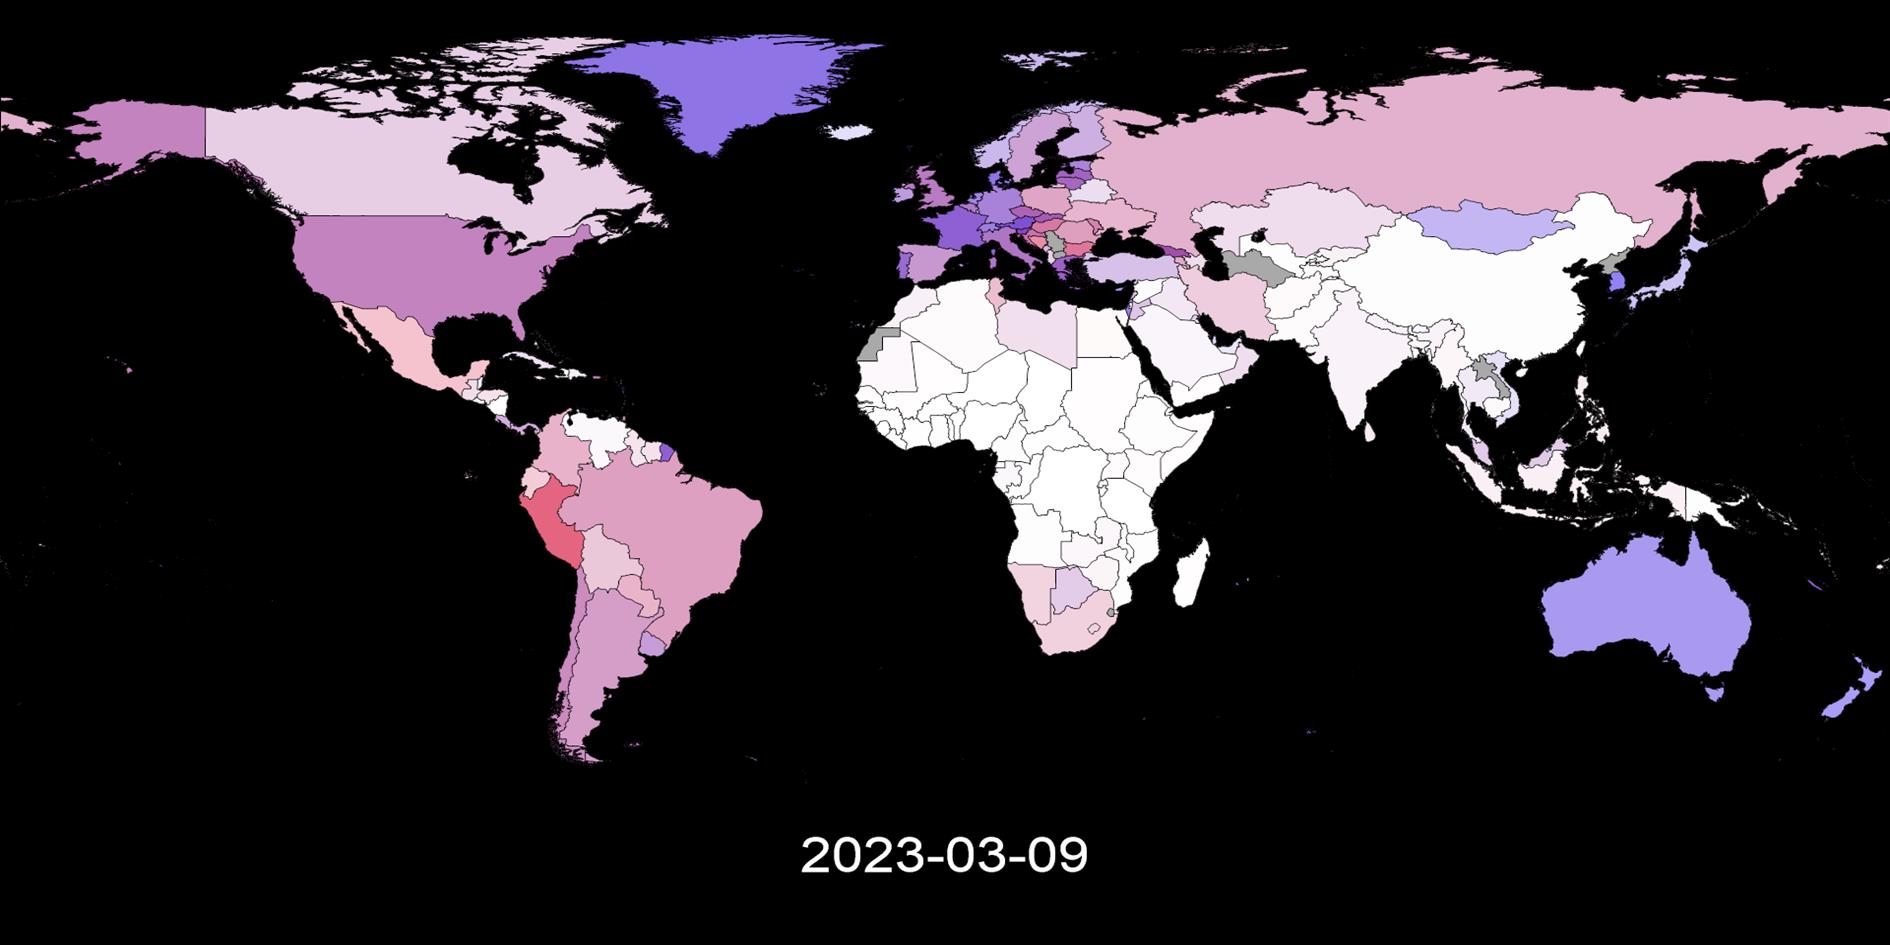
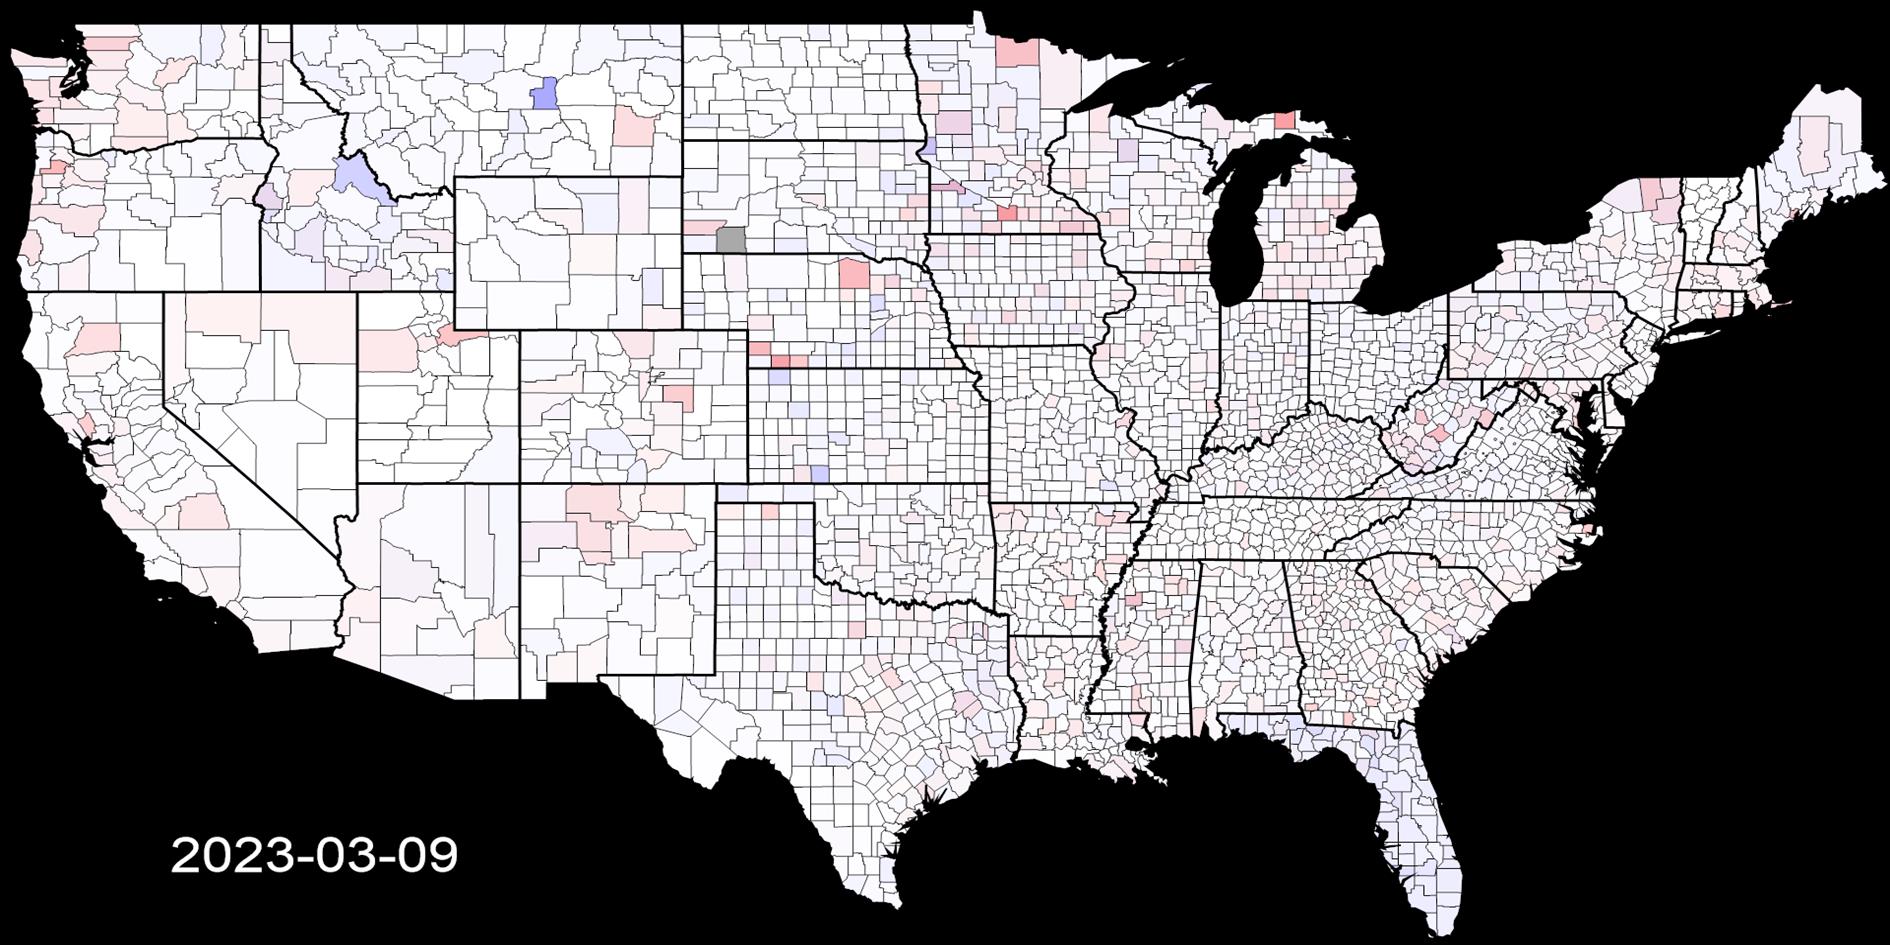
This post visualizes global and US county level coronavirus data from Johns Hopkins University. Four videos show both cumulative and week on week progression (comparing seven day moving averages) of the disease together with four images that show the most recent snapshot. It used to be updated weekly, this stopped August 5, 2023.
Cases and deaths are shown simultaneously using blue for cases and red for deaths. Where both are high a region will be a shade of purple. Regions with no data are dark gray.
The week on week incremental visualization is useful to see the history and current state of the spread of coronavirus. Each region is shaded based on the highest number of daily cases and deaths for that region and is relative to population. For example if the highest number of deaths reported on any day in San Francisco county is seven, then any day that has seven deaths will be the brightest shade of red. This shows where COVID-19 is relatively bad over time.
The cumulative visualization is shaded relative to the highest total death and case count for any region, relative to population.
As the location and date of the peak in week on week and cumulative cases and deaths change over time the videos will be different each time you watch. Bookmark this post and check back for weekly updates.
(This is the fifth version of this post as I have changed the data source and methodology several times. I usually preserve the previous version of any post but the changes are large enough that in this case I have removed them).
Cases and Deaths by Country
Week on Week Incremental
Cumulative
Cases and Deaths by US County
Week on Week Incremental
Cumulative
Related Posts
- Coronavirus Visualization Update
- San Francisco Crime 2003 to 2021
- San Francisco 311 Cases Animation
- Does closing the Great Highway cause an increase in traffic accidents?
- Animation of US PM2.5 Air Pollution in 2023
(Published to the Fediverse as: Visualizing Coronavirus Cases and Deaths by Country and US County #etc #coronavirus #shapefile #h5v Videos showing the spread of confirmed COVID-19 cases and death by country and US county/state per capita from 2020 to 2023. )
Coronavirus Hikes: May 2020
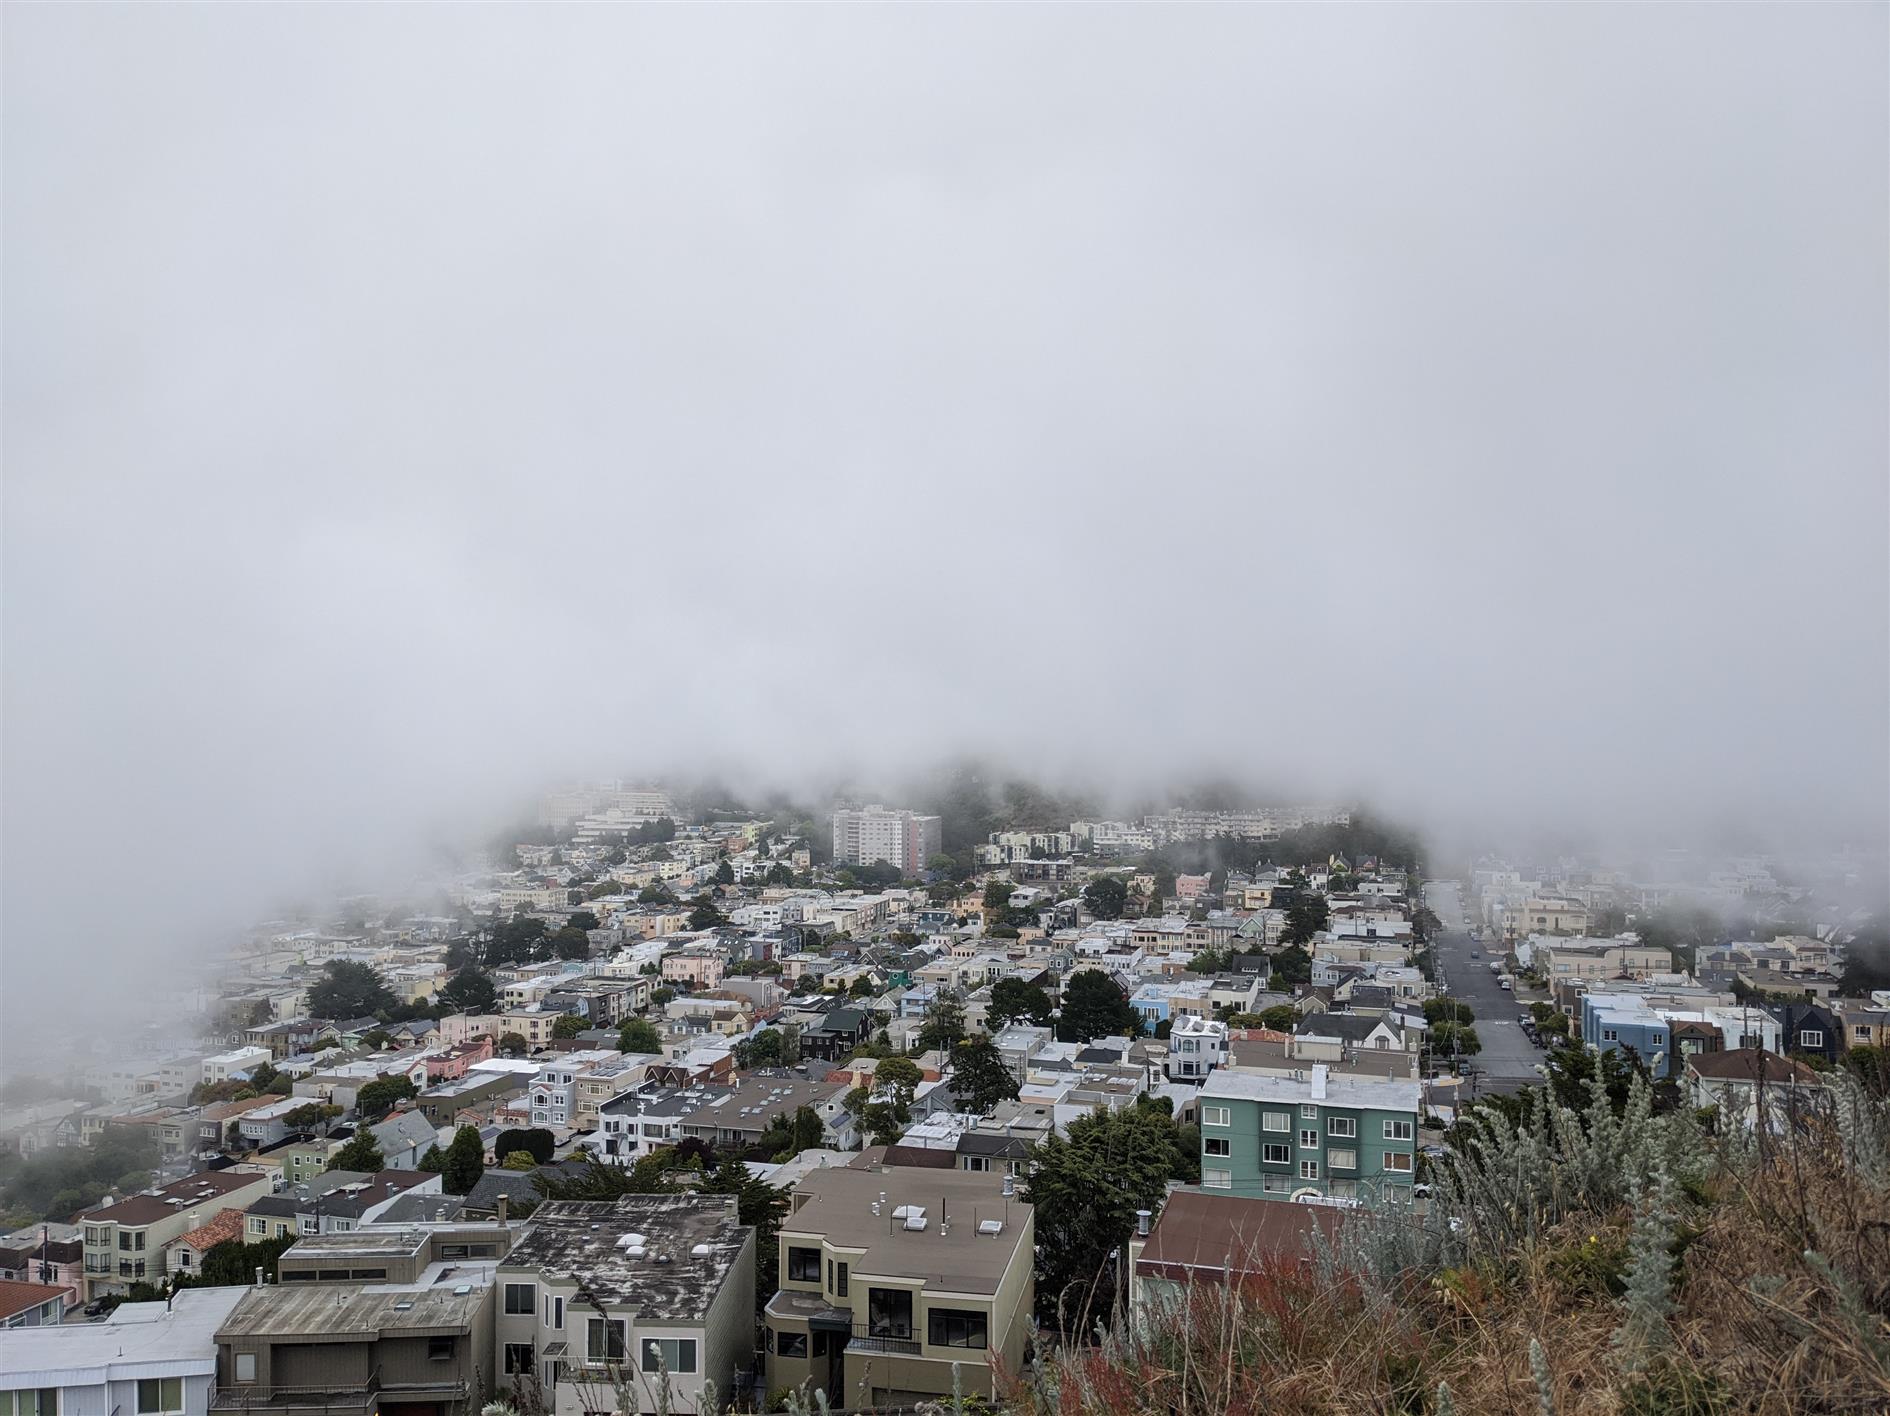
37.2 unique miles in May. Photo is the fog shadow behind Grand View Park.
Hike starts at: 37.741726, -122.471298. View in Google Earth.
Related Posts
- Coronavirus Hikes: June 2020
- Coronavirus Hikes: April 2020
- Coronavirus Hikes: July 2020
- Coronavirus Hikes: March 2020
- Coronavirus Hikes: Done
(Hike Map)
(Published to the Fediverse as: Coronavirus Hikes: May 2020 #hike #sanfrancisco #coronavirus #map Pandemic lockdown hikes around San Francisco for May 2020. )
Coronavirus Hikes: April 2020
36.4 unique miles in April (I'm not using the GPS for repeat hikes). Bagged Twin Peaks, wider paths than Mount Davidson.
Related Posts
- Coronavirus Hikes: May 2020
- Coronavirus Hikes: June 2020
- Coronavirus Hikes: March 2020
- Coronavirus Hikes: Done
- Coronavirus Hikes: July 2020
(Hike Map)
(Published to the Fediverse as: Coronavirus Hikes: April 2020 #hike #sanfrancisco #coronavirus Map of hikes around San Francisco during the Coronavirus lockdown: April 2020 )
Coronavirus Hikes: March 2020

Not getting far from home any time soon so all hikes for now will be local. I found a great web app, Routeshuffle, that will generate a random hike from the starting location of your choice. It's a great way of seeing streets you'd never venture down normally. The map is generated with some software I wrote to combine multiple KML files for easy rendering in Google Earth (oh, and Google Earth, I guess that does the heavy lifting). I'll post these every month while we're locked down. March is 15.6 miles total.
Hike starts at: 37.800778, -122.455943. View in Google Earth.
Related Posts
- Coronavirus Hikes: Done
- Coronavirus Hikes: April 2020
- Coronavirus Hikes: May 2020
- Coronavirus Hikes: June 2020
- Coronavirus Hikes: July 2020
(Hike Map)
(Published to the Fediverse as: Coronavirus Hikes: March 2020 #hike #coronavirus #sanfrancisco #map Pandemic lockdown hikes around San Francisco from March 2020 )
Social Undistancing

We have to be six feet apart in space but so far there are no rules on time.
Related Posts
- Coronavirus Hikes: Done
- Every Coronavirus Article
- Coronavirus Hikes: March 2020
- Coronavirus Hikes: June 2020
- Coronavirus Hikes: April 2020
(Published to the Fediverse as: Social Undistancing #photo #coronavirus Composite photograph of many people and cars walking past my house during the Coronavirus lockdown. )