Hoylake Beach
By Robert Ellison. Updated on

Timelapse looking over Hoylake beach in the Wirral, UK.
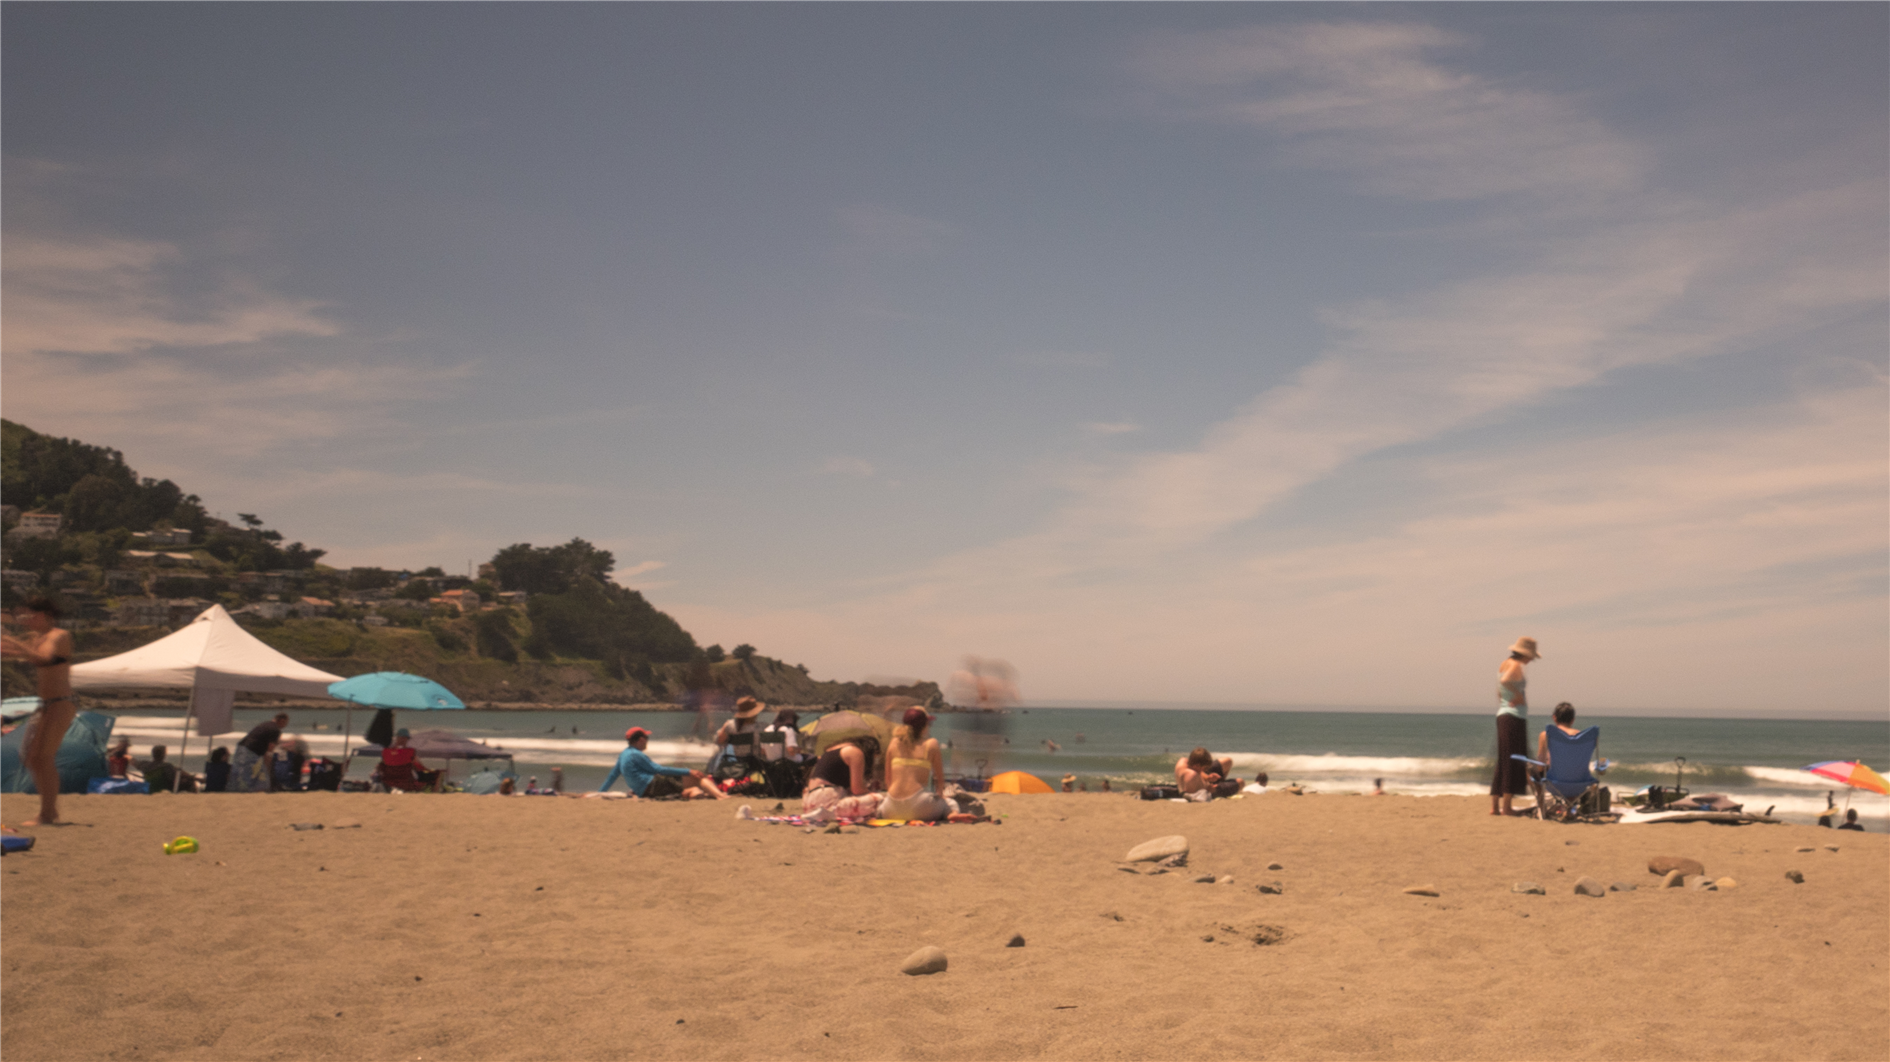
Timelapse of Pacifica State Beach (on a rare warm and sunny day).

Conway's Game of Life, for 1,830 generations, starting from a random pattern. Instead of showing the live cells this animation focuses on death - each dead cell gets a little bit greener with each generation. You can just about make out a few static patterns in the darkness and the lines cruising through are left behind by gliders. Mostly though you're watching the horrible loss of life caused by cellular social isolation.
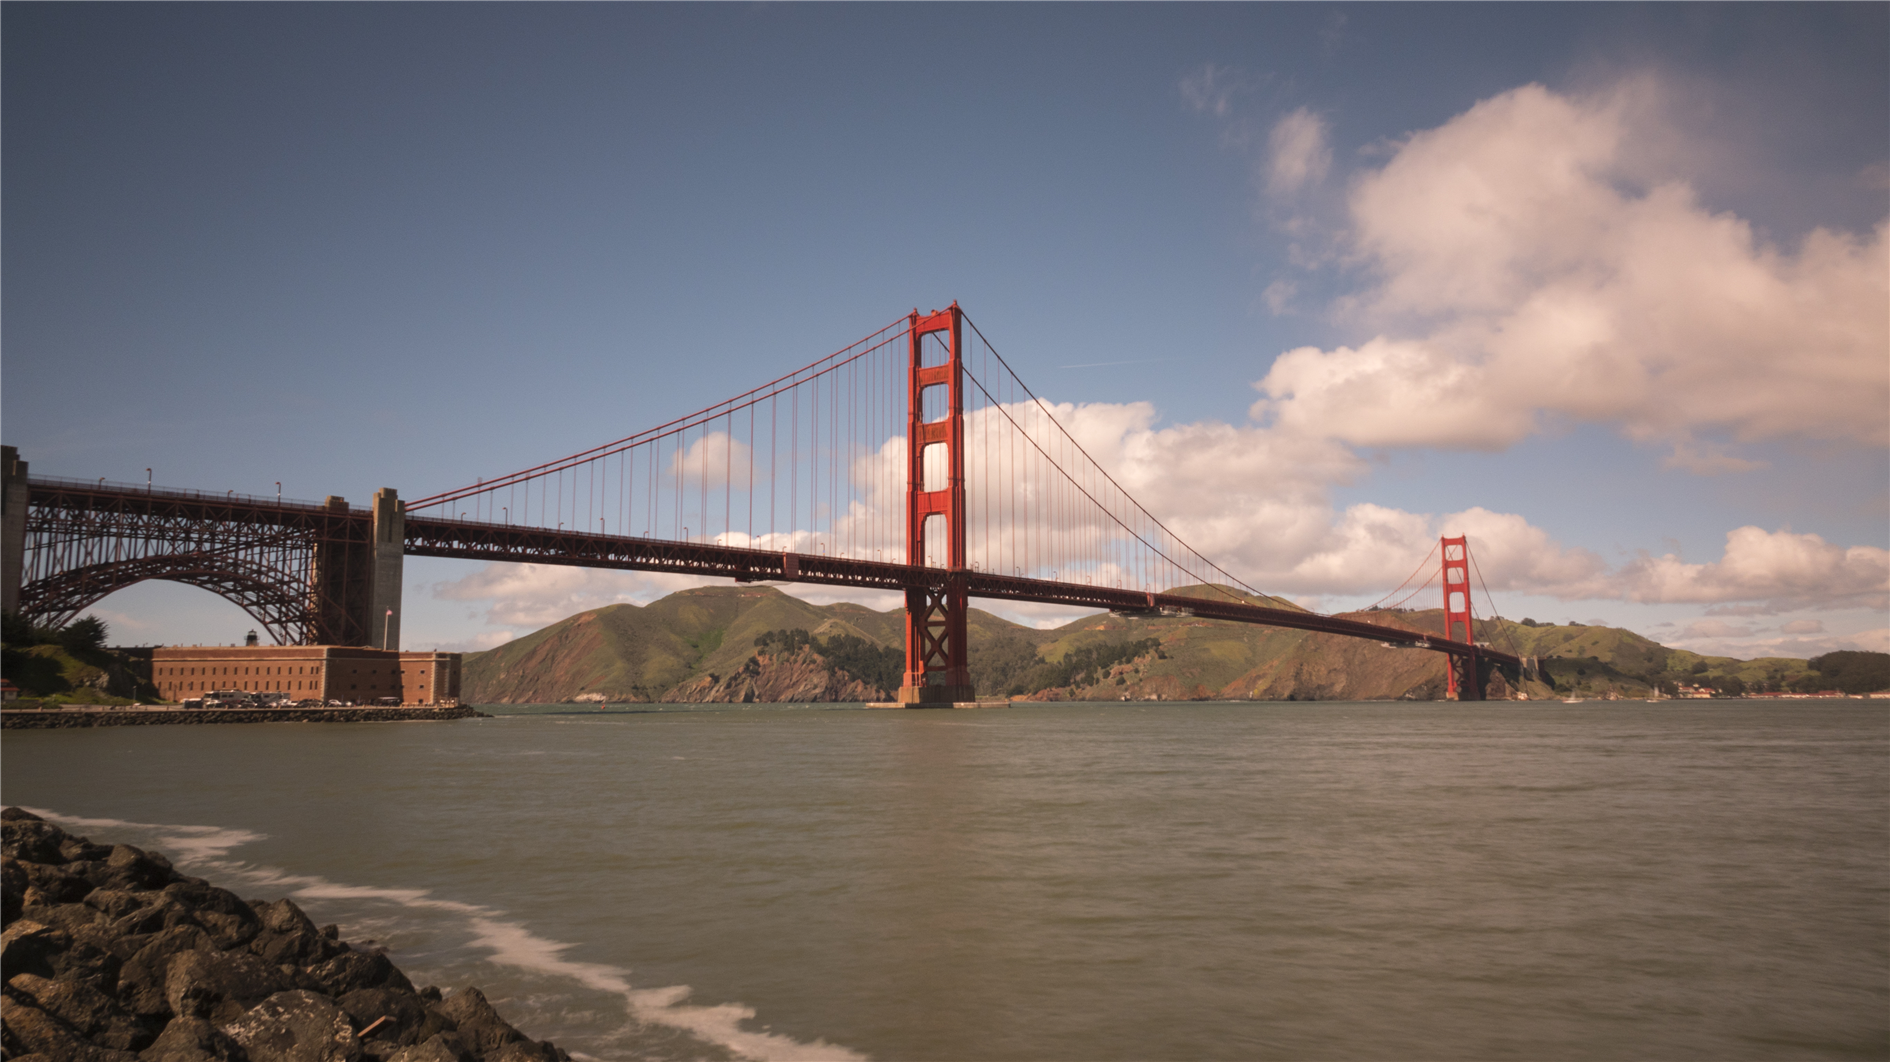
Shot from the Marin headlands, the Golden Gate Overlook and near Fort Point. I used an RX10 IV with an ND3.0 filter. Raw images were captured every four seconds with a one second exposure time. Edited with LRTimelapse and scored with Filmstro Pro.
I was expecting a pretty sunny day but ended up with regular showers and some pretty wild swings between sunshine and cold soggy overcast weather. I think the occasional raindrop and the mood swings work quite well, although the wind caused a bit of wobble on the long zoom onto the deck of the bridge.
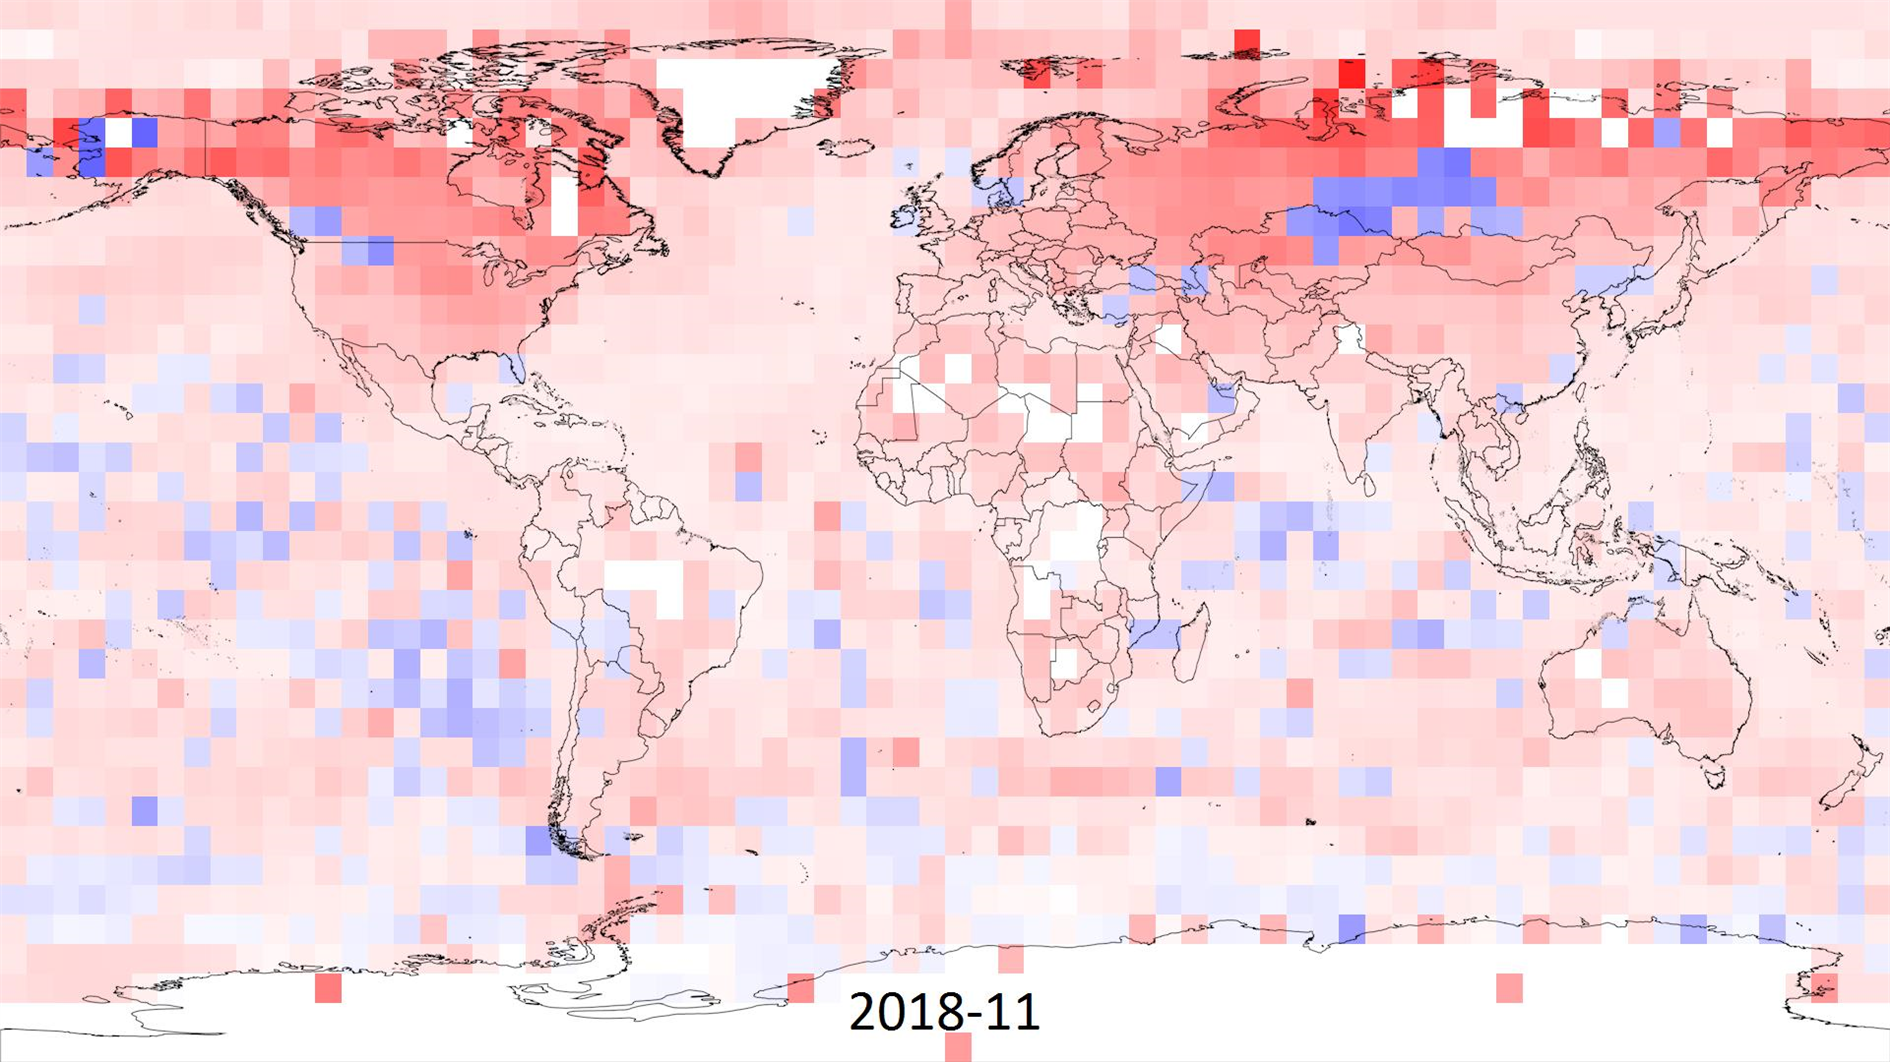
I made this animation to visualize climate change based on the HadCRUT 4 data (specifically the ensemble median gridded data) from the Met Office Hadley Centre.
HadCRUT 4 provides temperature anomalies in a five degree grid by month and year from January 1850 to November 2018 (as of this post). Anomaly here means deviation from the 1961-1990 average.
In the animation I wanted to capture the full timespan of the data but also show long term trends. Each frame is a month of data and each five degree grid of longitude and latitude is colored based on the maximum cumulative anomaly (positive or negative) for each decade. The range for color is 0 to +/- 20.85 degrees, red for warmer and blue for cooler. This means there is a reset at the start of each decade, the first few years are mostly random noise but by the end of each decade you're seeing the range of extremes.
Spoiler alert - you can spot something happening in the last three decades.
As well as the change in temperature it's interesting to watch the increase in global coverage over time. It's surprising that even the most recent years have no readings for Antarctica. Here's a paper (PDF) discussing the impact of the missing data. The HadCRUT 4 FAQ has more detail on how the temperature anomalies were assembled.

A timelapse from Treasure Island in the San Francisco Bay.
The first half of the video is looking west from Treasure Island and pans along the San Francisco waterfront. The second half was shot east towards Oakland and includes a storm sweeping in from the north.
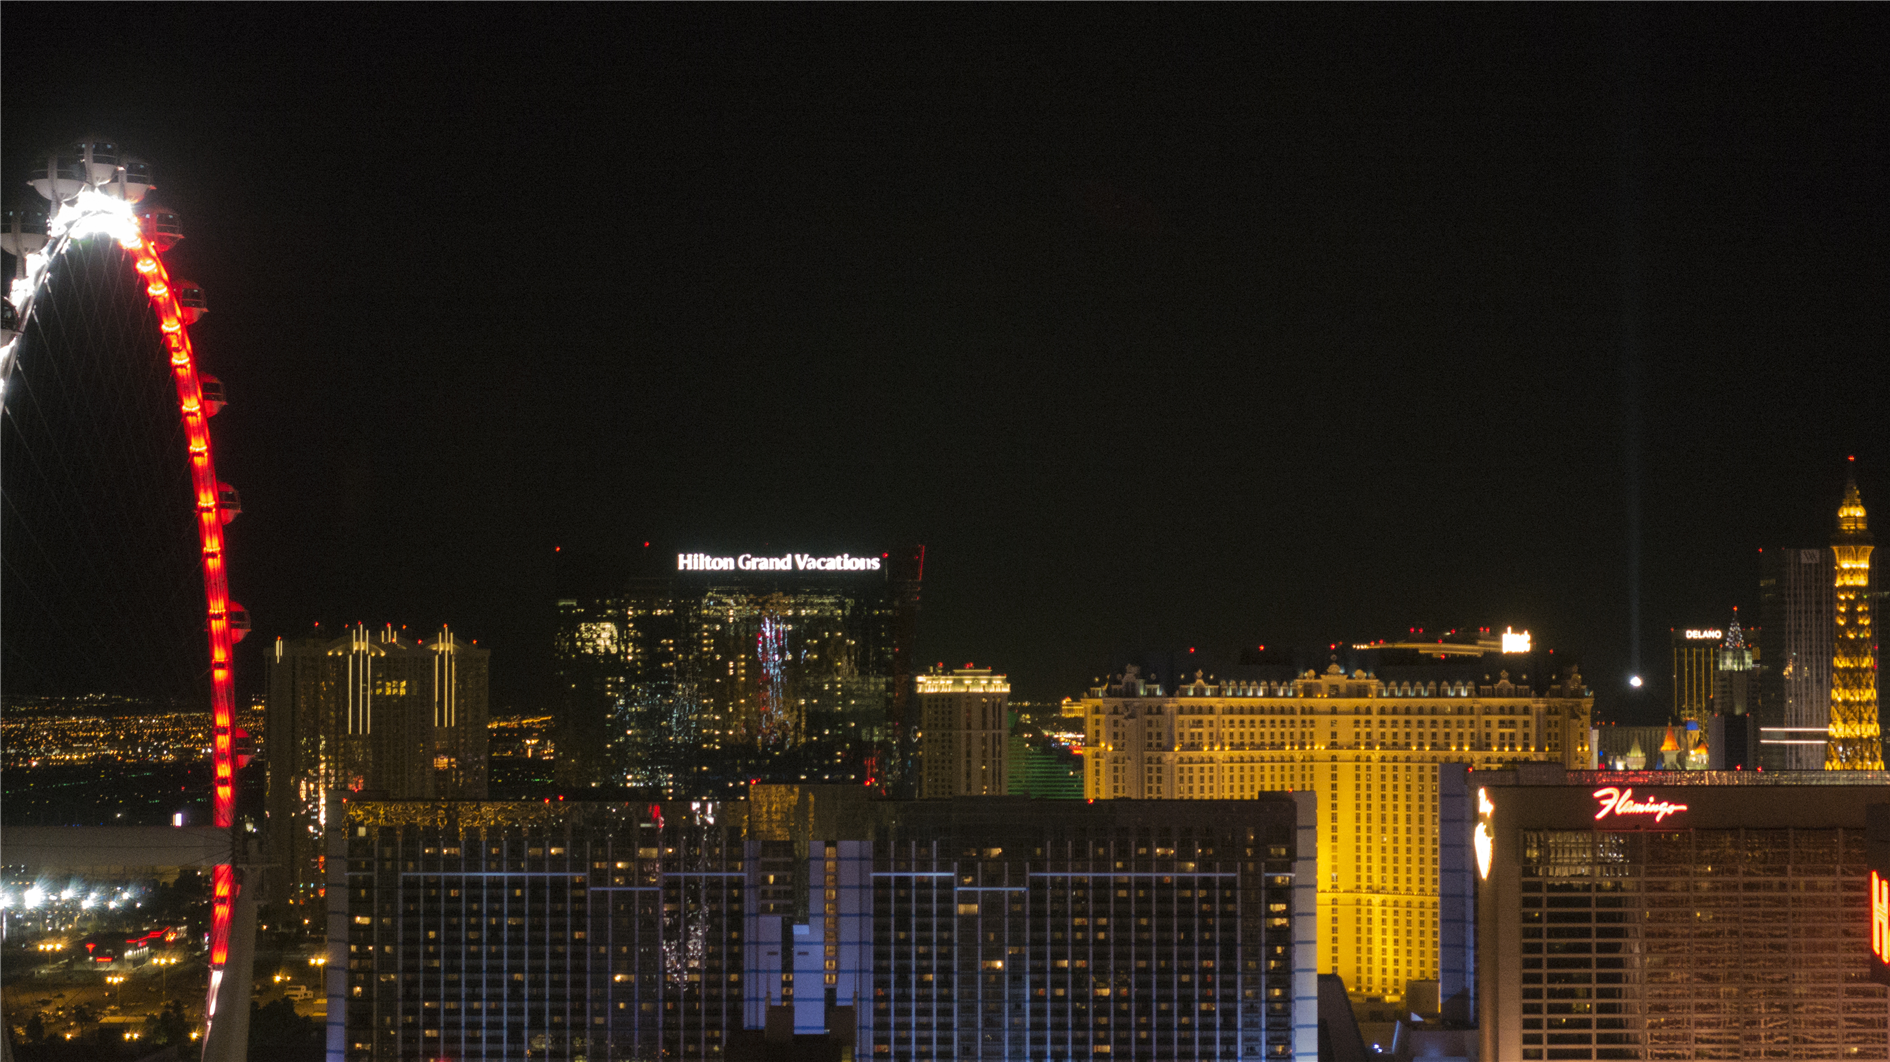
Sunset timelapse of the 550 foot Ferris Wheel at The Linq in Las Vegas, Nevada (technically the High Roller Observation Wheel).
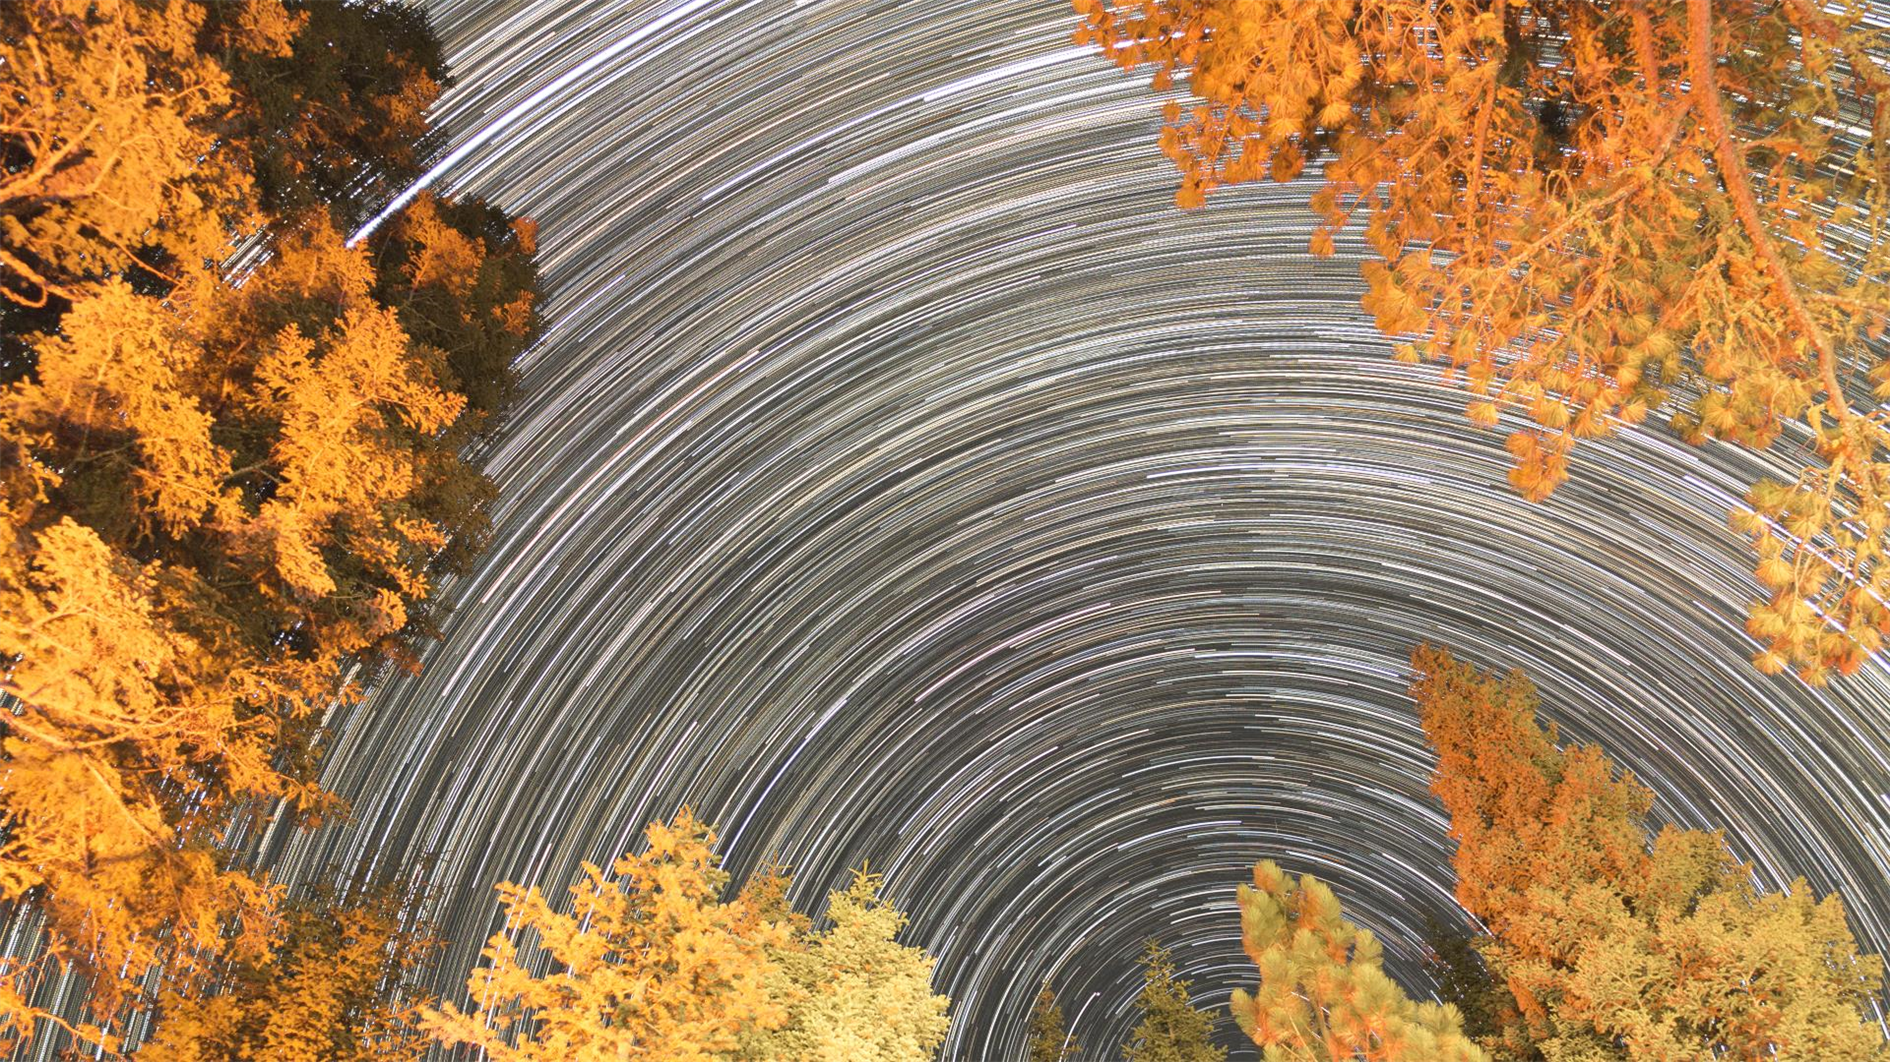
A timelapse two ways shot from the Manzanita Lake campground at Lassen Volcanic National Park (the second time I've visited and the second time that Bumpass Hell has been closed). First a regular 4K timelapse looking up from the campsite:
The second version is the same footage in HD where each frame is the cumulative maximum pixel value of all the frames up to the current frame (so it builds in star trails as the video runs):

A genetic algorithm learns to draw a hummingbird:
The video is an animation of three thousand generations of evolution. It starts with a random mix of line segments which are then mutated by adding or removing lines and by changing the start, end and color of existing lines. Each generation has 32 individuals. The best individual is mutated to create the next generation.
For this implementation the best or fittest individual is the one with the least error on a pixel by pixel comparison to a stock art drawing of a hummingbird. Because I care more about the shape than completely filling in the drawing an error outside the figure is penalized three times more than a gap inside the figure.
Color is mutated each generation but not selected for, so it's just changing randomly.
Timelapse looking over Hoylake beach in the Wirral, UK.

The Bay Model in Sausalito is a two-football field sized working model of the San Francisco Bay and Sacramento - San Joaquin River Delta. Here's a 360 degree timelapse of the model in action so you can see the tide coming in and out (best in a VR headset but you can pan around as well):
Shot on a Ricoh Theta S and post-processed in LRTimelapse and Adobe Lightroom.