Daily Average Global Cloud Cover Animation
By Robert Ellison.
nobody:
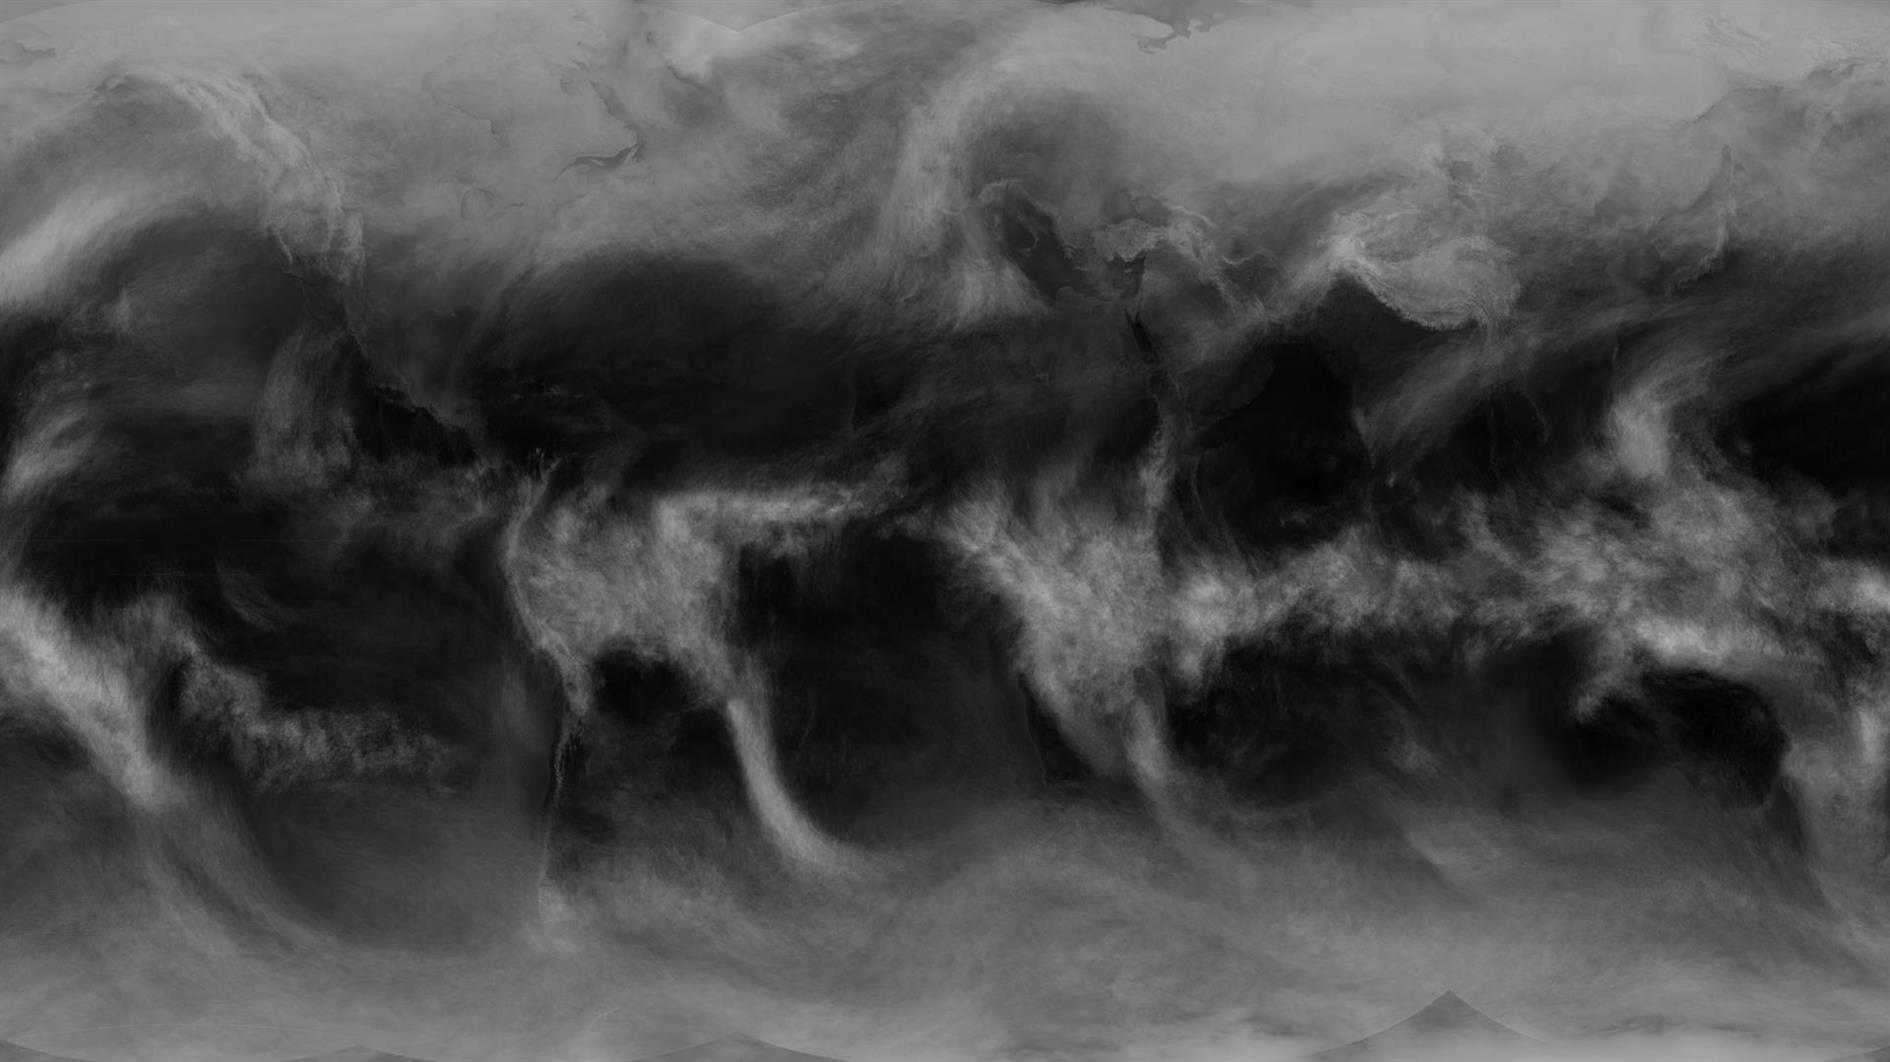
me: What if I used a year of global cloud cover images to make an animation where each frame is the average of the past 24 hours?
The animation covers August 2020 to August 2021. See this video for a version without the averaging (and with the Earth's surface).
The averaged version shows some interesting cycles better than the frenetic pace of hourly cloud cover. In my area you can really see the high pressure off the coast of California that sends any rain off to our friends in Seattle.
Images are from the University of Wisconsin-Madison Space Science and Engineering Center, specifically the Global IR product, transformed as described here.
Add Comment
All comments are moderated. Your email address is used to display a Gravatar and optionally for notification of new comments and to sign up for the newsletter.