Book reviews for January 2019

Insurrecto by Gina Apostol
3/5
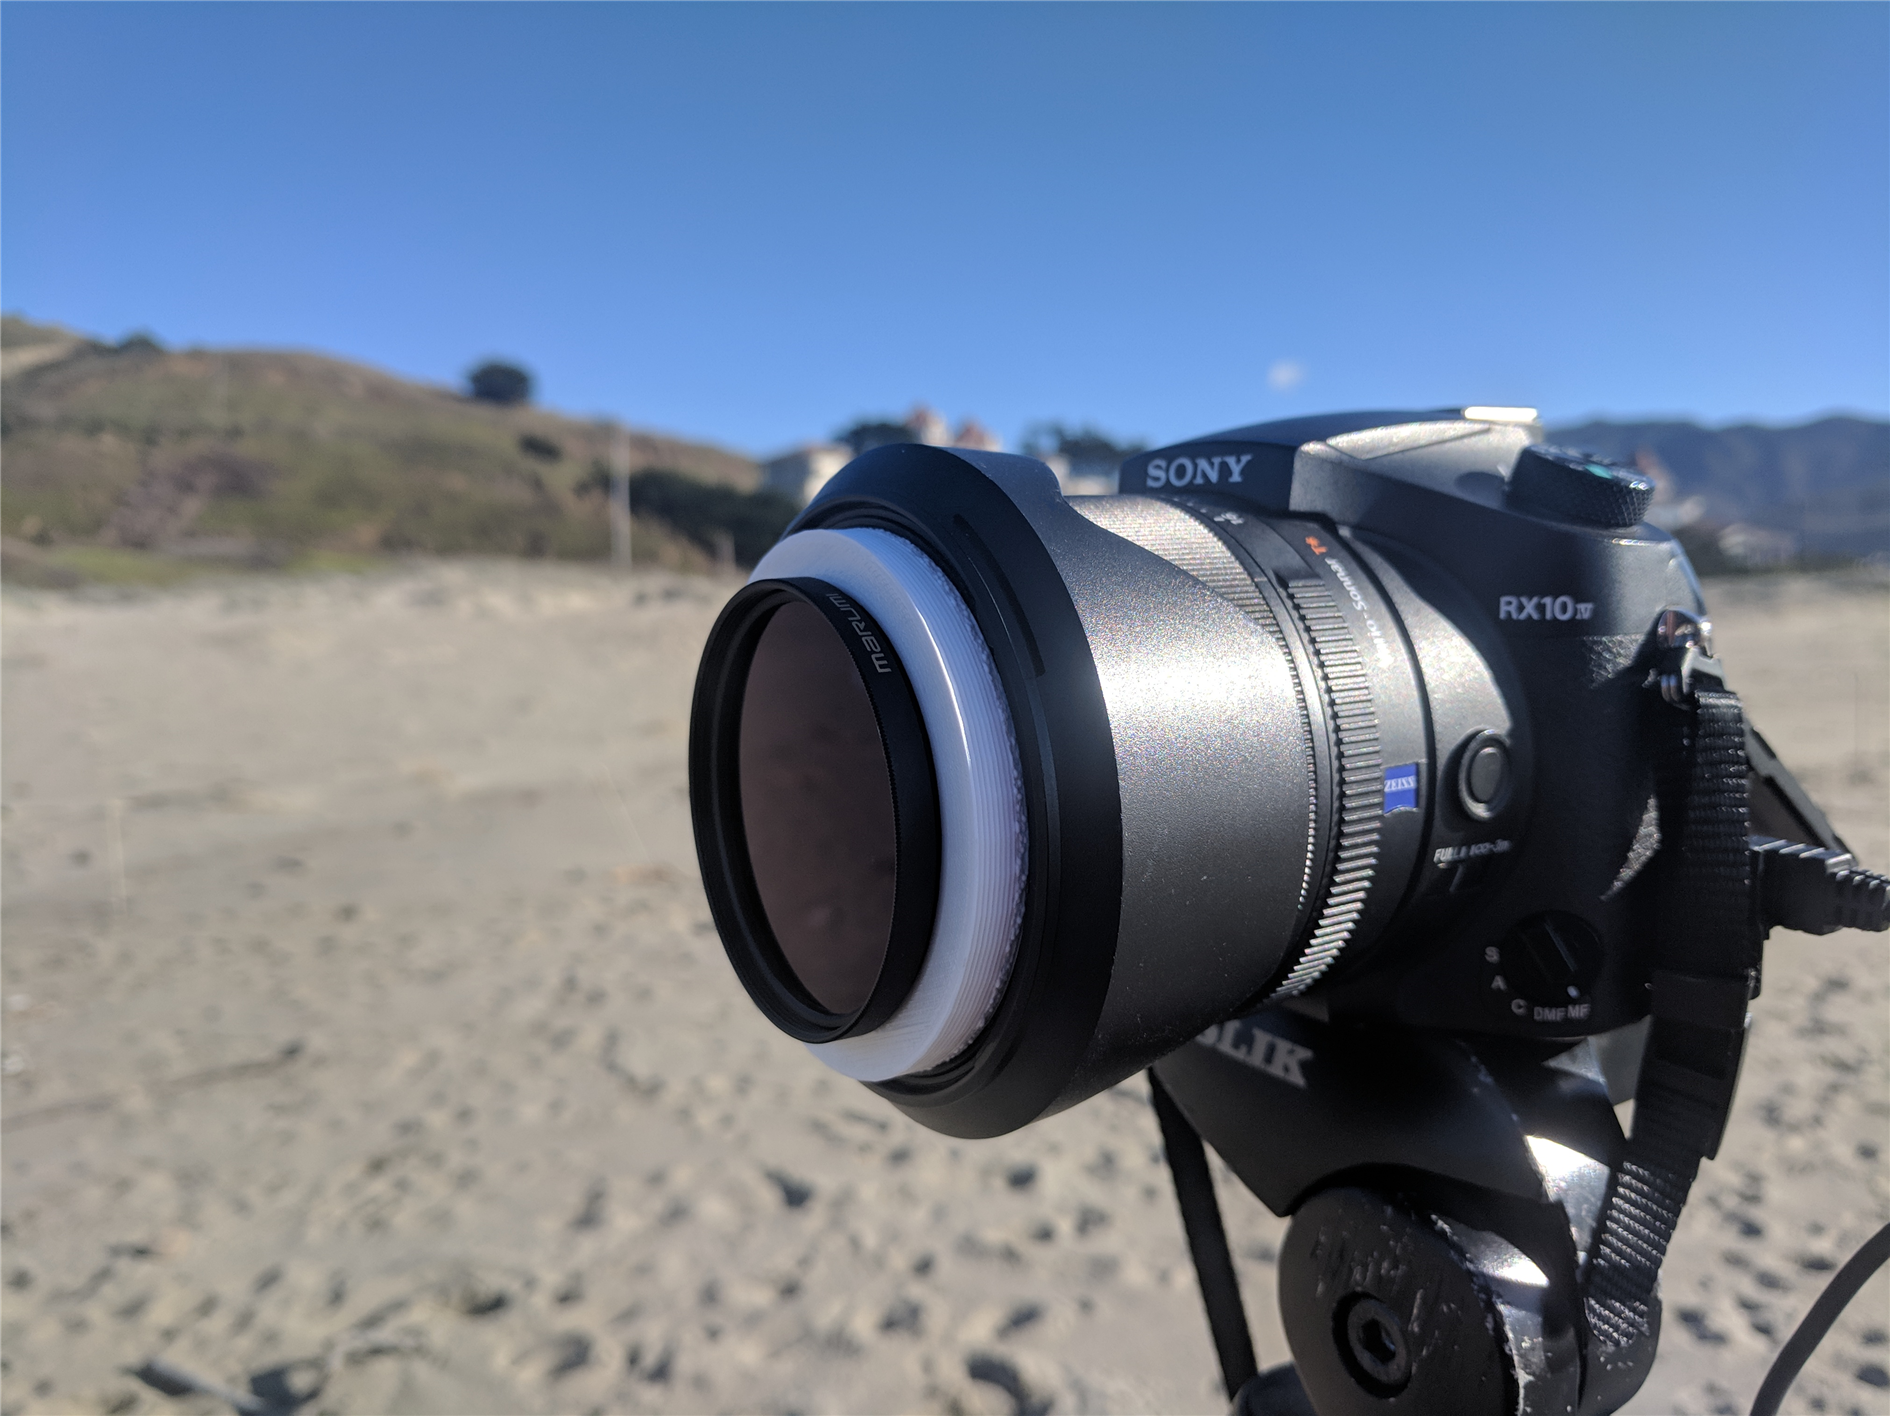
I have a 58mm ND5 filter that I bought to photograph the 2017 solar eclipse. It worked pretty well for that with my Sony RX100 V, but now I want to use it with an RX10 IV (which has the advantage of a 600mm equivalent zoom). The RX10 accepts 72mm filters and I want to try and photograph an ISS transit which is happening sooner than I can get hold of an adapter.
I figured someone must have done this before, but I can't find a file anywhere. It's a reasonably straightforward part - as the filter is smaller than the thread on the camera I just need a small cylinder which has a 72mm thread on the outside and 58mm on the inside. A step up adapter would be slightly more complicated to accommodate the larger filter size.
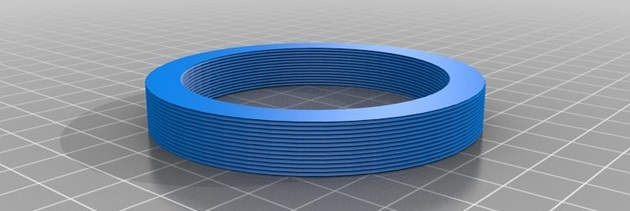
To build this I used OpenSCAD and this thread module. Open the thread module file in OpenSCAD and then you just need to subtract the inner thread from the outer thread like this:
This makes a simple 10mm tall adapter and you would just need to change the thread sizes to make it work for pretty much any combination of camera and filter (most filter sizes use a 0.75mm pitch as shown above). The vignetting is pretty extreme with the smaller filter and the size of the adapter. For this application I don't care, I'm only using the center of the image. If it's a problem for your application then it might be worth reducing the height of the adapter, at the expense of making it harder to detach from the camera.
Here is the adapter STL file on thingiverse.
After all that, I missed the transit by a couple of seconds. I thought the clock on my phone would be accurate enough but turns out it's 5 seconds off. So memo to self for next time - shoot over a longer window, or just take a video.
(Published to the Fediverse as: 3D Printing a 72-58mm step down Camera Filter Adapter #etc #3dprint #solar #filter #thingiverse #iss How to 3D print a step down camera filter adapter with OpenSCAD code and the STL file for a specific 72mm to 58mm project (adapting a solar filter for a Sony RX10 IV camera). )

A Bohol Tarsier photographed at the Philippine Tarsier and Wildlife Sanctuary.
(Published to the Fediverse as: Philippine Tarsier #photo #tarsier Photo of a Bohol Tarsier at the Philippine Tarsier and Wildlife Sanctuary on the island of Bohol. )

If the atmosphere was the United States here's how it would break down:
Thor, Iowa is Hydrogen. Thor is the birthplace of John K. Hanson, founder of Winnebago. 179 people.
Florence, South Dakota is Krypton. 371 people.
Butterfield, Minnesota (home of the Butterfield Steam and Gas Engine Show) is Methane, 586 people.
Lewisport, Kentucky is Helium. Abraham Lincoln was unsuccessfully tried for operating a ferry without a license here in 1827. 1,706 people.
Maquoketa, Iowa is Neon. As of the time of writing Maquoketa Caves State Park is closed for bat hibernation. 5,921 people.
Gainesville, Florida is Carbon Dioxide. It's ranked by the National Coalition for the Homeless as the 5th meanest city. 132,567 people.
Chicago, Corpus Christi and Kimball, West Virginia make up Argon. 3,042,217 people total.
All that adds up to around 1% of the atmosphere, mostly Argon.
Oxygen is about 20%, that's California, New York, Oregon, Louisiana, Lake Station, Indiana and Cedar, Kansas. 68,225,139 people.
If you're not listed then you are Nitrogen. Close to 80% at 254,334,562 people.
(Population figures from the US Census 2017 estimates. Atmosphere composition from Wikipedia. Water vapor not included.)
(Published to the Fediverse as: Comparing the Atmosphere to the Population of the United States #etc #atmosphere Which cities an states correspond to each gas in the atmosphere if the population of the United States is broken down in the same proportion. )
3/5

The Echo Clock has one job, and it's not great at it.
I made an animation of maximum temperature anomalies by decade from the 1850s to the 2010s.
Is 2019 the year that Trump gets impeached? I wrote to my representative. Why not do the same?
Some surfing dolphins.
Farhad Manjoo calls for open borders in the New York Times for many of the same reasons I had back in 2015, before this was less unpopular ;)
Previously:
New Year's resolution: hike more again.
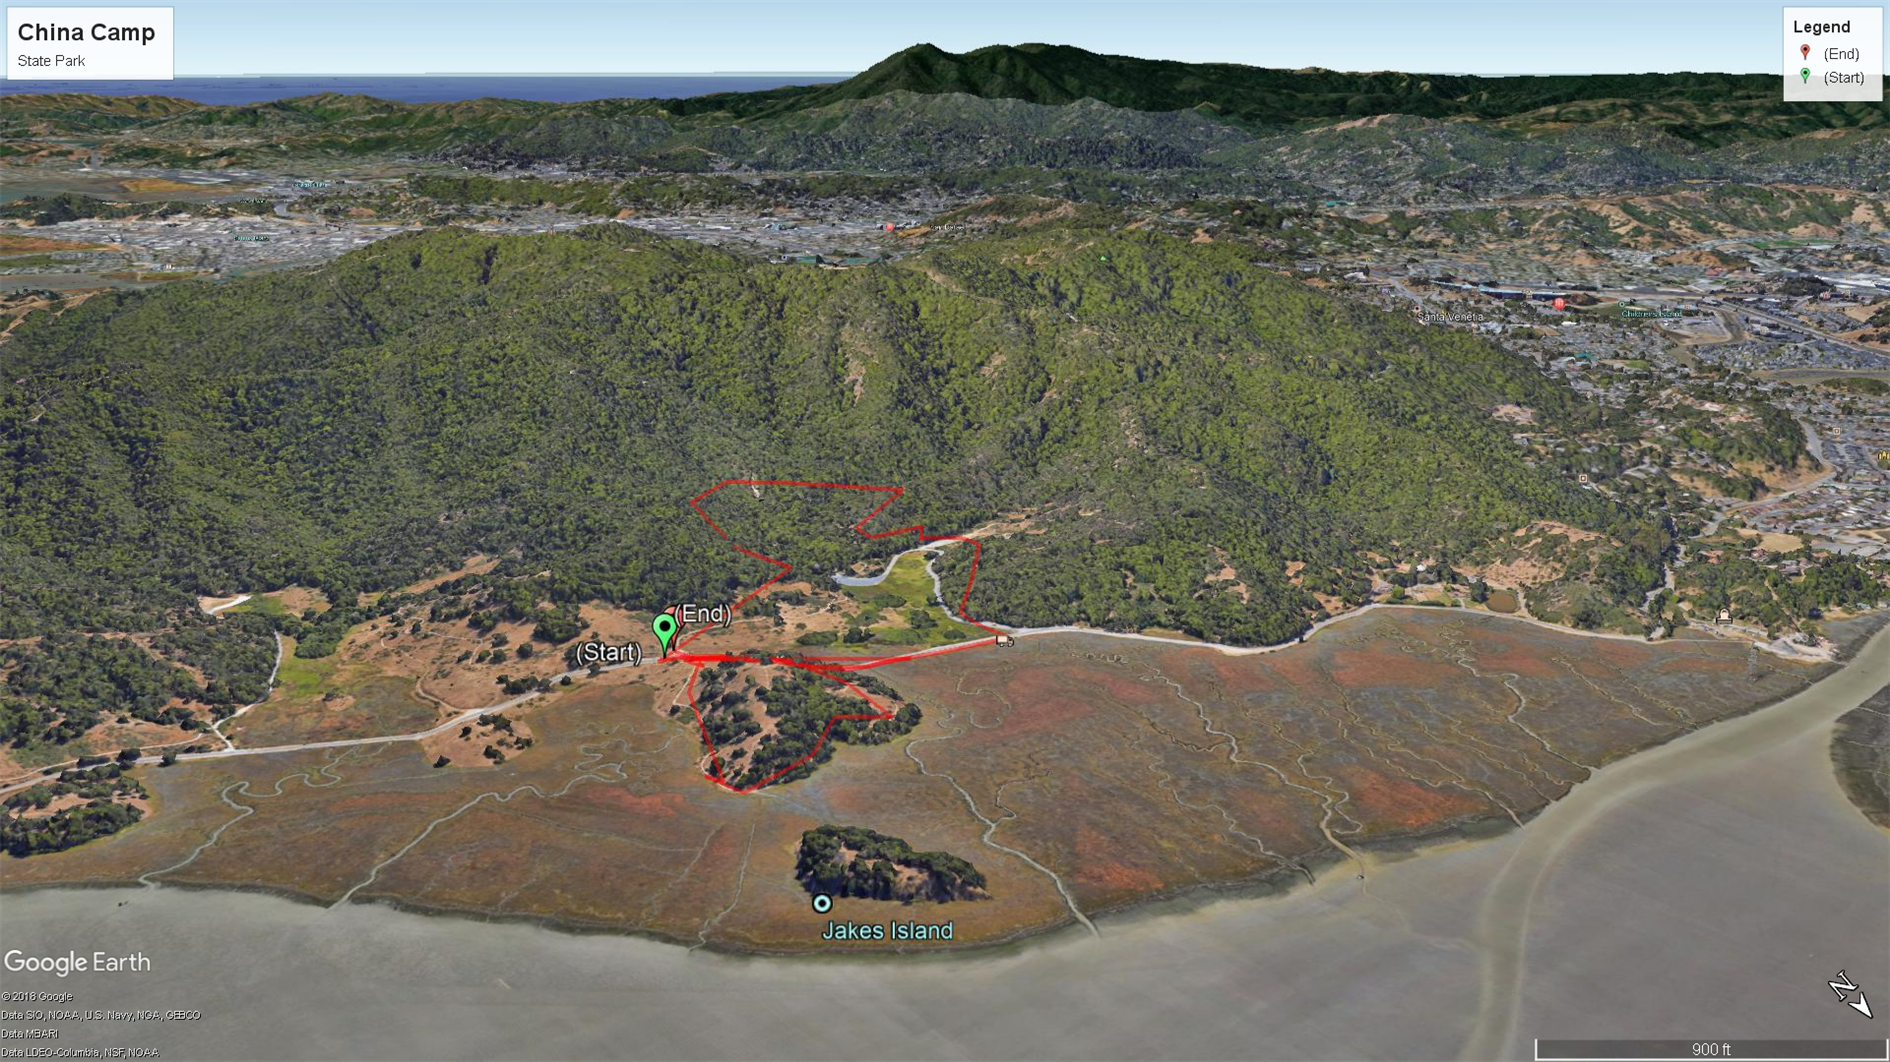
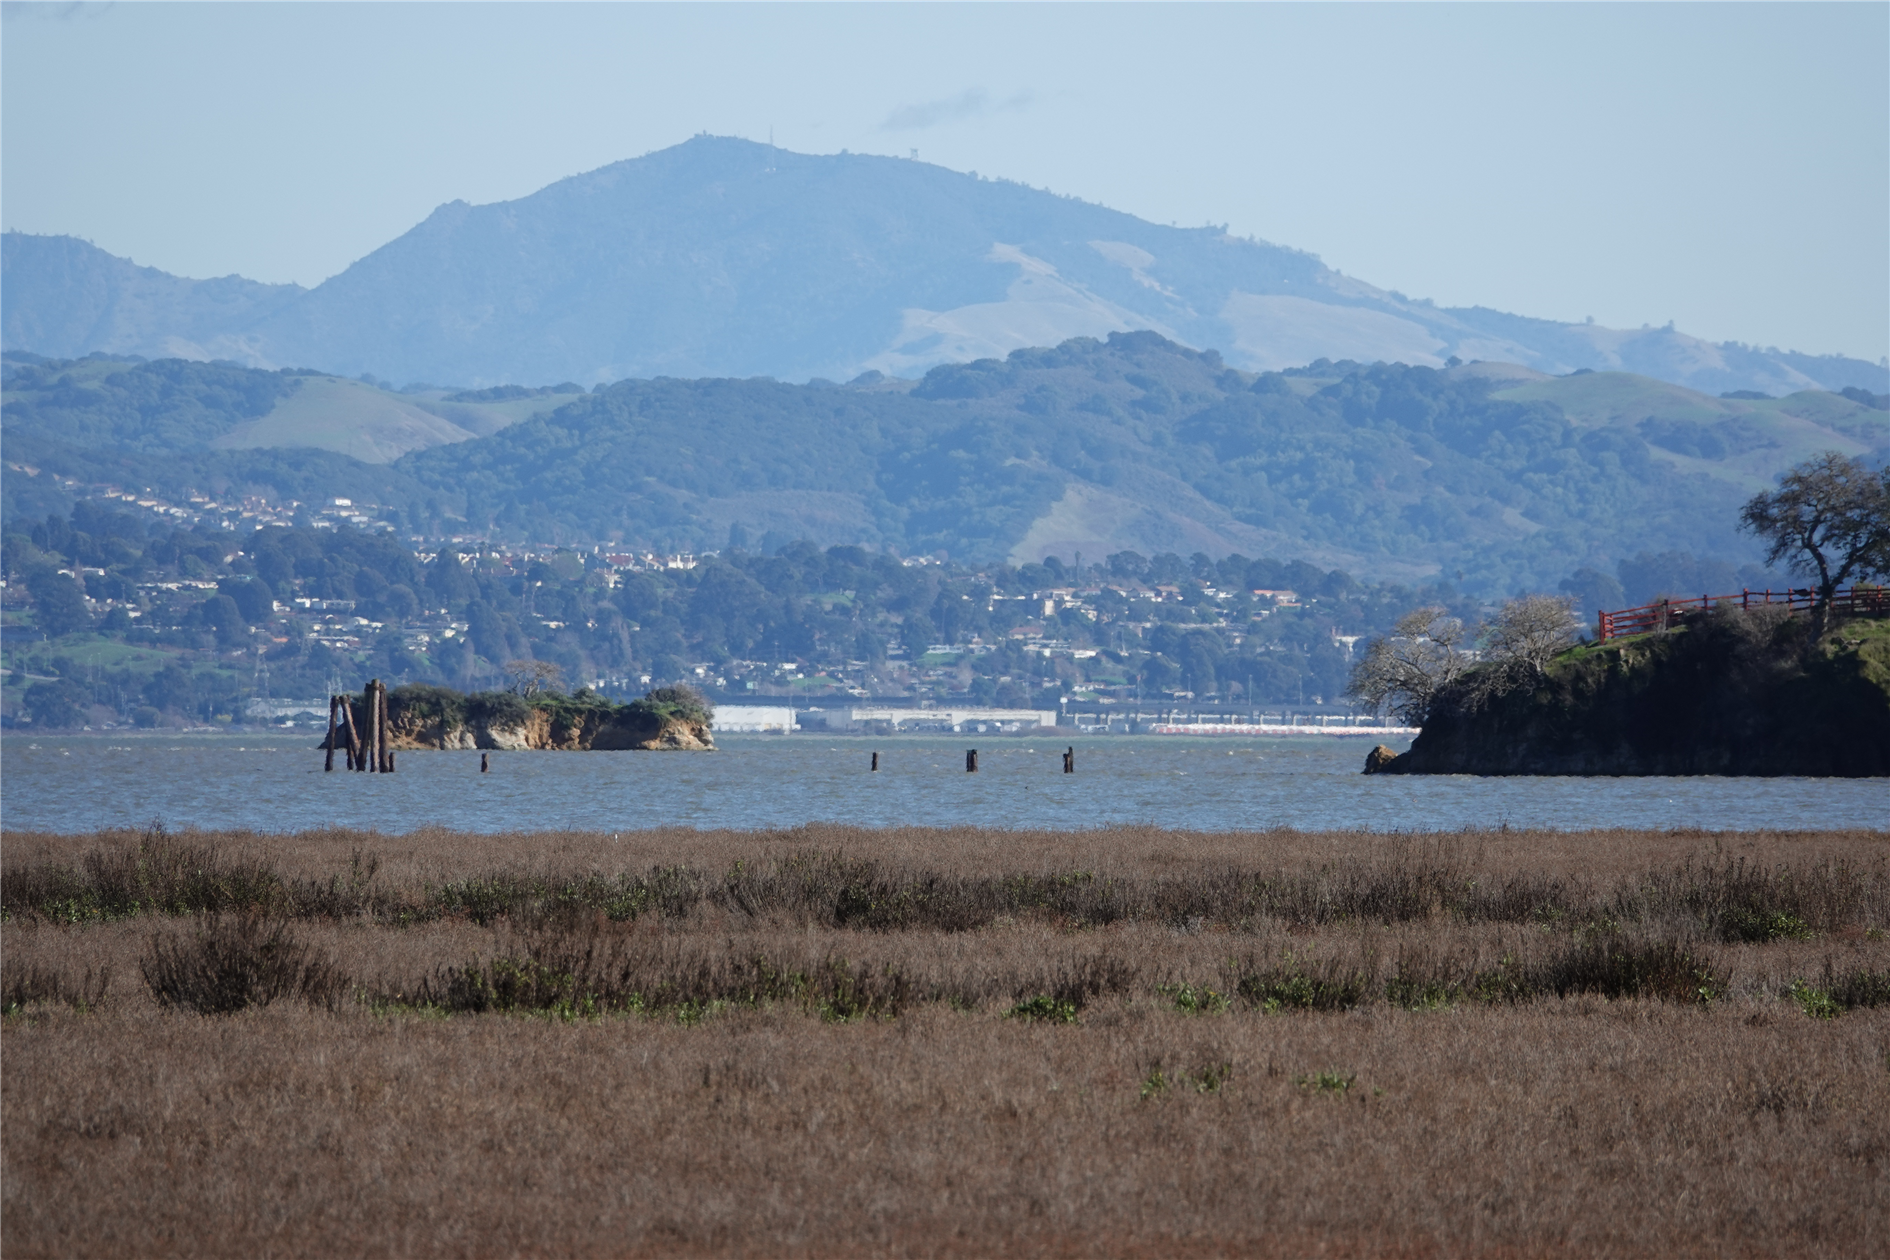
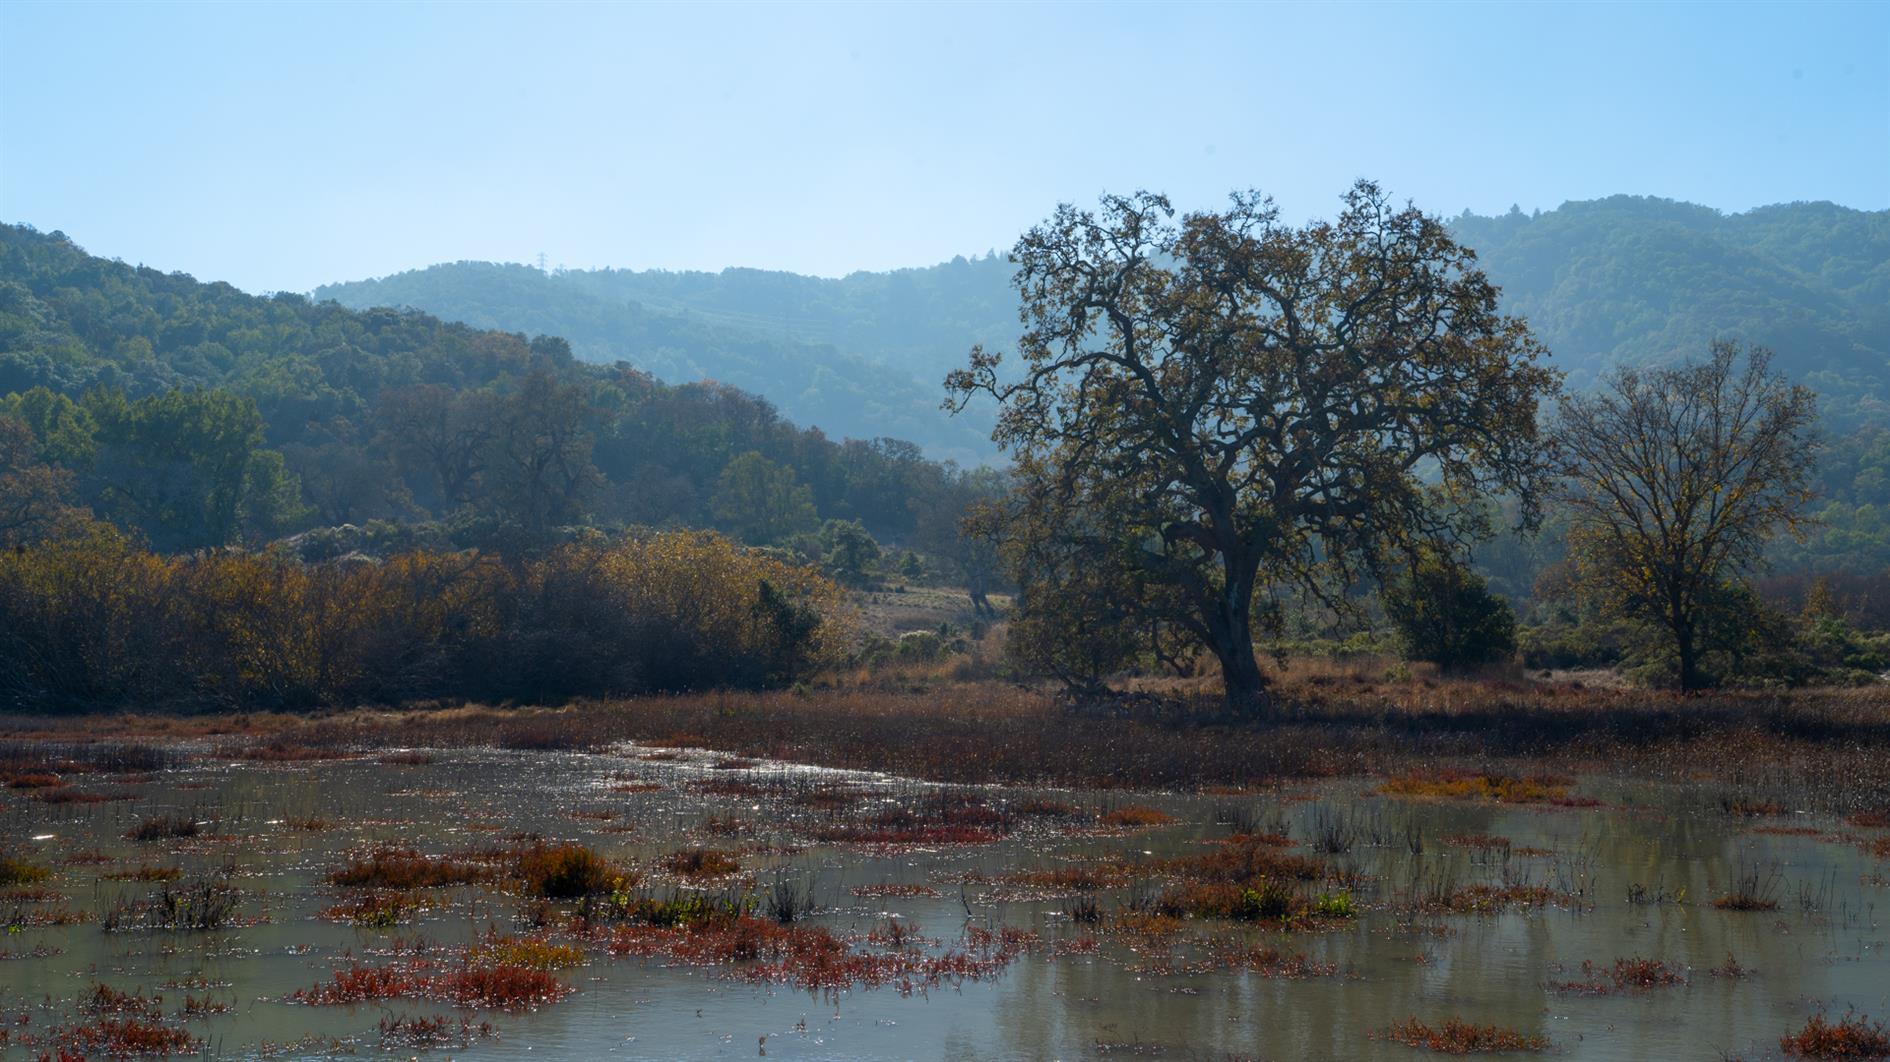
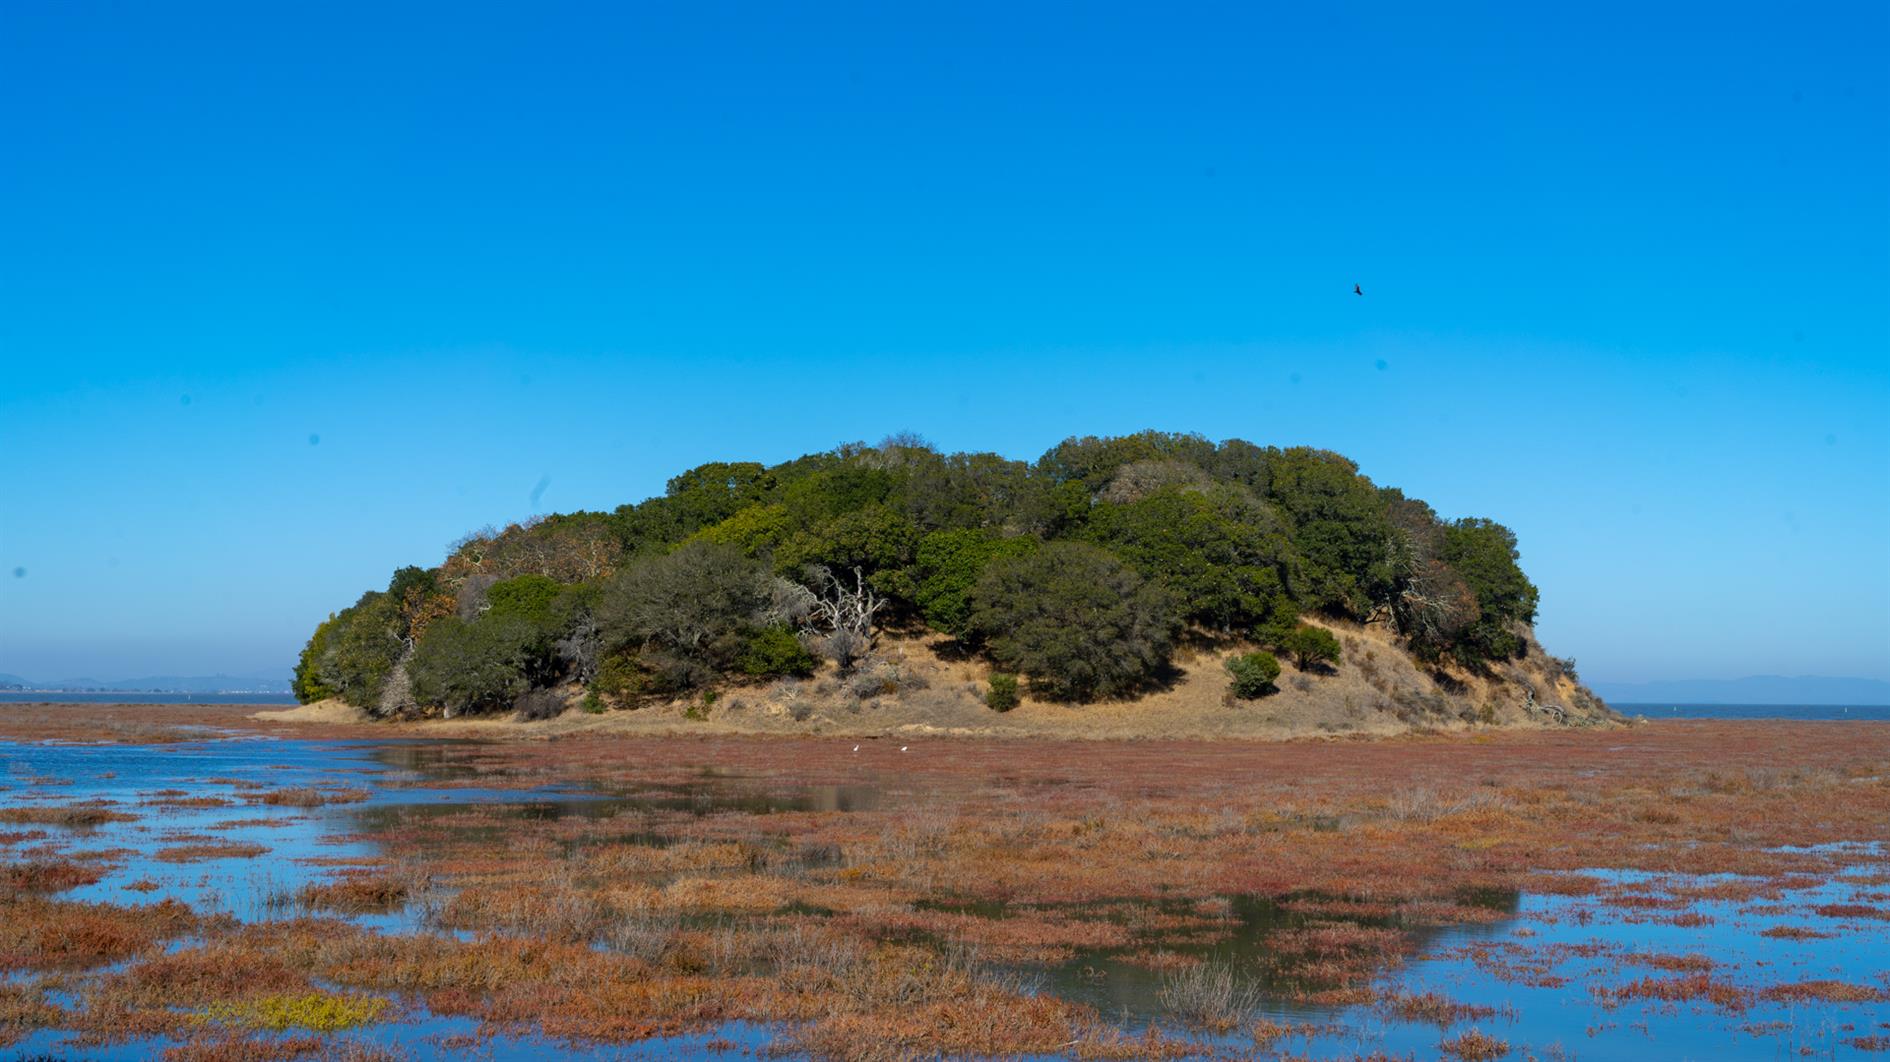
This is a combined hike of Back Ranch Meadows and Turtleback Point loop at China Camp State Park (around 2.7 miles total). Have never been to China Camp before, it's a beautiful park forty minutes north of San Francisco with plenty of interesting looking trails so will be back again soon.
(Hikes was my first blog, now folded into ITHCWY. Here's an old post about the blog. Since the last update I've ditched My Tracks because it got terrible and switched to Gaia GPS. I also moved from BlogEngine.net to my own custom blogging platform which is mostly better but hasn't worked well for my hike posts. I had to manually upload any KML files and also manually scrape out the coordinates for the start of the hike. Today I've automated this for my post by email system - I just need to attach a KML file to the email and it gets automatically uploaded to the blog and the start point is used to link to Google Maps, geocode the post and include an embedded map. Pretty cool. Hopefully this will inspire me to hike more and post more hikes as well.)
Hike starts at: 38.00733, -122.490322. View in Google Earth.
Updated 2022-11-24 14:14:
(Hike Map)
(Published to the Fediverse as: China Camp State Park #hike #chinacamp #map Back Ranch Meadows and Turtleback Point loop hikes at China Camp State Park. )
It turns out I'm not great at getting a monthly newsletter out. Starting with the January 2019 newsletter I've put in place a new system - I'm storing summaries of new articles when I write them and also collecting a few links that might be of interest to ITHCWY readers. These should be sent out automatically on the first of the month so I should only skip the newsletter if nothing happened. Apologies in advance if there are any teething issues with the new format.
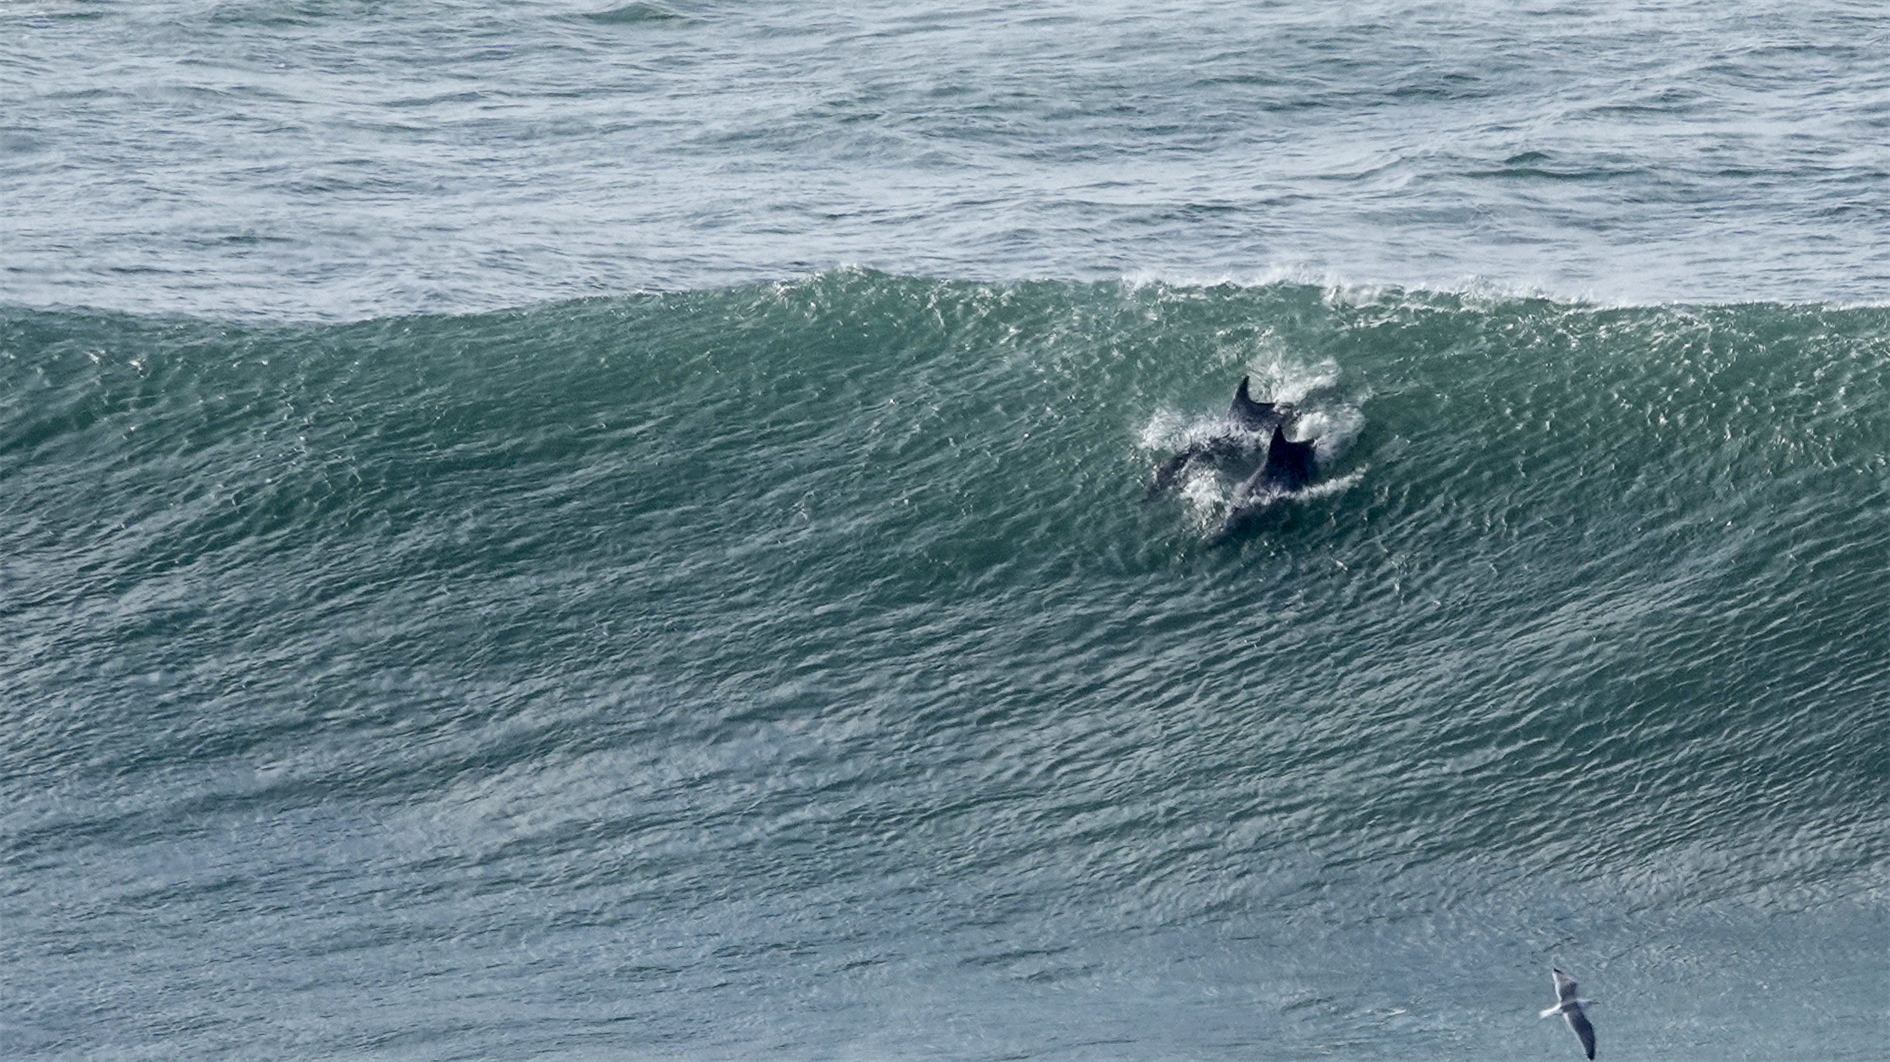
A pair of dolphins enjoying high surf off Ocean Beach, San Francisco
(Published to the Fediverse as: Surfing Dolphins #photo #dolphin Dolphins photographed off Ocean Beach, San Francisco )
Sent to Speaker Pelosi today:
As an American, constituent and supporter I am writing to ask you to investigate President Trump for high crimes and misdemeanors and to pass articles of impeachment in the House.
You have said that impeachment must to be bipartisan. That would certainly need to be the end result in order for the effort to succeed. It does not make sense as a precondition for starting the process, especially if as you also said impeachment should not be started or avoided for a political reason.
You have also said that impeachment must wait for the completion of the Special Counsel investigation. Any crimes revealed by the investigation would be icing on the cake. By imposing this condition you are making the case that obstruction of justice by the President is normal, that violations of campaign finance law are minor and that using the office for personal enrichment is only to be expected. The President deserves to be tried in the Senate for these charges. The future of our democracy depends on us not accepting this behavior.
Disagreements on policy and personality should be resolved by the electorate. High crimes and misdemeanors are your job. Please do it.
(Published to the Fediverse as: Open letter to Nancy Pelosi #politics #trump #impeach ##resist #pelosi Disagreements on policy and personality should be resolved by the electorate. High crimes and misdemeanors are your job. Please do it. (Open letter to Nancy Pelosi) )
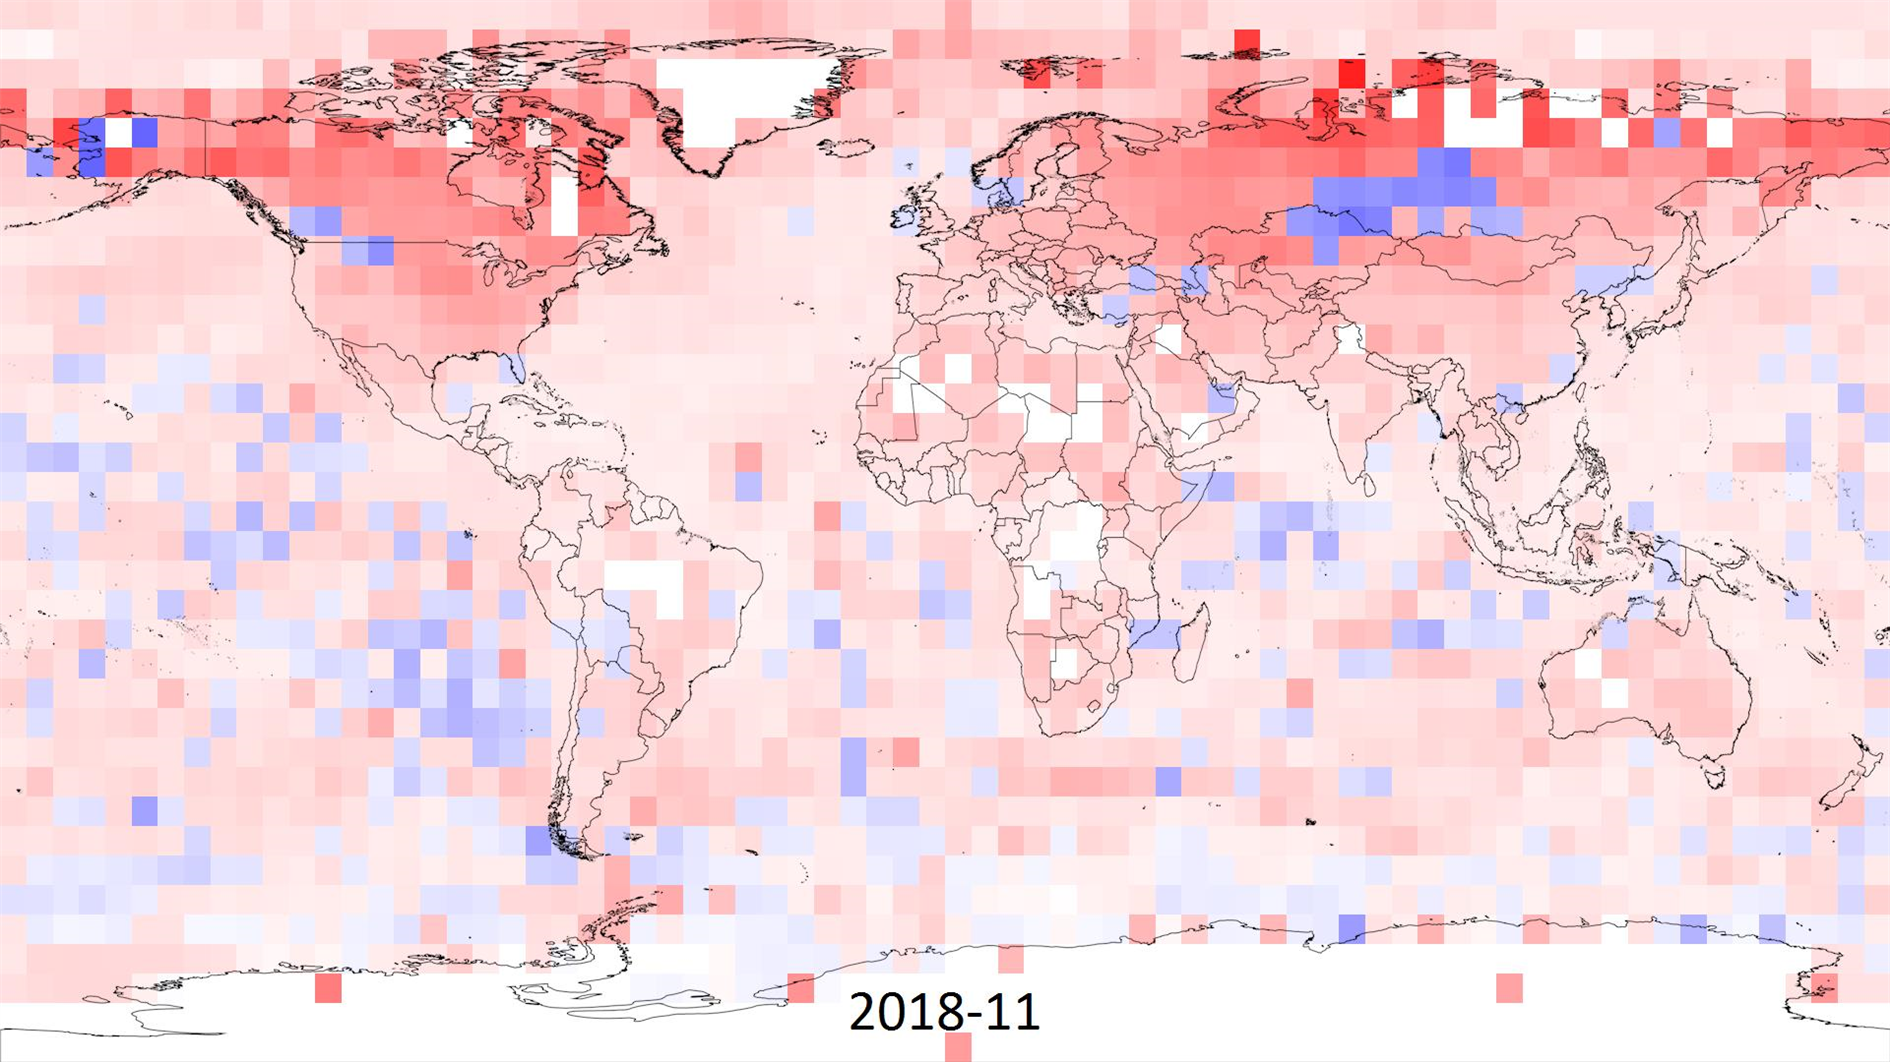
I made this animation to visualize climate change based on the HadCRUT 4 data (specifically the ensemble median gridded data) from the Met Office Hadley Centre.
HadCRUT 4 provides temperature anomalies in a five degree grid by month and year from January 1850 to November 2018 (as of this post). Anomaly here means deviation from the 1961-1990 average.
In the animation I wanted to capture the full timespan of the data but also show long term trends. Each frame is a month of data and each five degree grid of longitude and latitude is colored based on the maximum cumulative anomaly (positive or negative) for each decade. The range for color is 0 to +/- 20.85 degrees, red for warmer and blue for cooler. This means there is a reset at the start of each decade, the first few years are mostly random noise but by the end of each decade you're seeing the range of extremes.
Spoiler alert - you can spot something happening in the last three decades.
As well as the change in temperature it's interesting to watch the increase in global coverage over time. It's surprising that even the most recent years have no readings for Antarctica. Here's a paper (PDF) discussing the impact of the missing data. The HadCRUT 4 FAQ has more detail on how the temperature anomalies were assembled.
(Published to the Fediverse as: Global Temperature Anomalies Animation, 1850 to 2018 #timelapse #animation #climatechange #environmentalism #video Animation of maximum cumulative temperature anomaly by decade from January 1850 to November 2018 based on the HadCRUT 4 data set. )
Export Google Fit Daily Steps, Weight and Distance to a Google Sheet
Accessing Printer Press ESC to cancel
Monitor page index status with Google Sheets, Apps Script and the Google Search Console API
Download a Sharepoint File with GraphServiceClient (Microsoft Graph API)
Upgrading from word2vec to OpenAI
Scanning from the ADF using WIA in C#
International Date Line Longitude, Latitude Coordinates
Automate Google PageSpeed Insights and Core Web Vitals Logging with Apps Script
Enable GZIP compression for Amazon S3 hosted website in CloudFront
User scoped custom dimensions in Google Analytics 4 using gtag