Animation of US PM2.5 Air Pollution in 2023
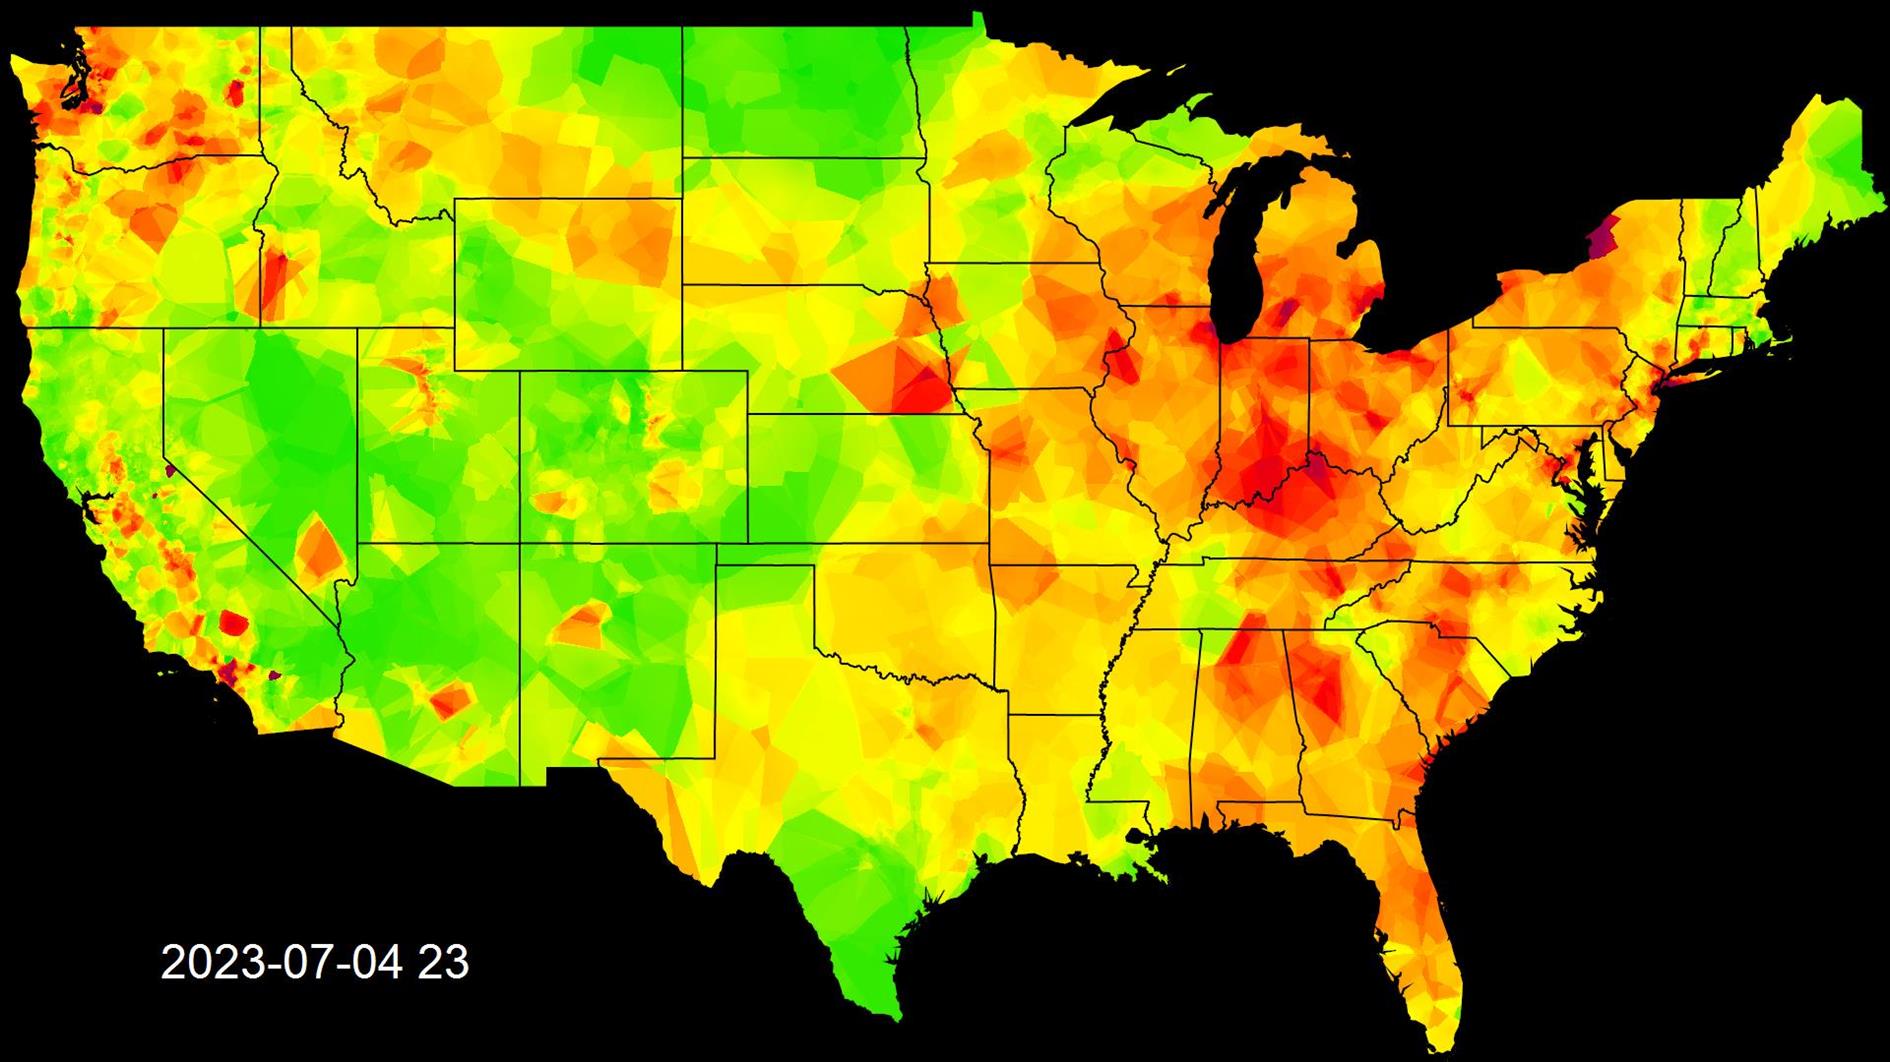
The video below shows PM2.5 air pollution in the United States from February to November 2023. The frame above is the impact of fireworks on the 4th of July. It's a blink and you miss it moment in the video but a pretty incredible impact.
I started this project in February expecting it to be more of a long term thing. Unfortunately, Purple Air started charging for their API in November, more than I was willing to pay for this project.
In terms of wildfires this year the big story in the continental US has been Canada belching plumes of smoke down across the East Coast. I didn't include Hawaii or Alaska in the map and so there is nothing for the tragic Lahaina fire on Maui.
To make the video I had a Google Apps Script running that pulled the Purple Air sensor data hourly. I then wrote an app to periodically render the data to frames using my shapefile library to plot the US and then interpolating the air quality for each pixel from the nearest sensors. The frames are stitched together at 60 frames per second using ffmpeg and final production was in DaVinci Resolve with music from Filmstro.
Related Posts
- Daily Average Global Cloud Cover Animation
- Animation of a year of Global Cloud Cover
- Coronavirus Visualization Update
- San Francisco 311 Cases Animation
- The color of yesterday
(Published to the Fediverse as: Animation of US PM2.5 Air Pollution in 2023 #etc #video #purple Video showing US PM3.5 air pollution in 2023 using Purple Air sensor data. )
Add Comment
All comments are moderated. Your email address is used to display a Gravatar and optionally for notification of new comments and to sign up for the newsletter.