California Climate Credit

Once in a while I'm stupid enough to read my email. This month I'm getting a climate credit! Must have done something right? No:
"The California Climate Credit is part of California’s efforts to fight climate change. This credit is from a state program that requires power plants, natural gas providers, and other large industries that emit greenhouse gases to buy carbon pollution permits. The credit on your bill is your share of the payments from the State’s program."
So... apparently part of fighting climate change is making my energy bill randomly cheaper?
It's hard to think of anything less likely to help. Just as I'm starting to feel the pain of winter bills I'm paying slightly less and so I'm slightly less inclined to turn down the heating or finally do something about my beautiful but effectively absent front windows.
A problem with carbon taxation is that it's regressive. So why not use this money to make the first $xx cheaper, and maybe even charge more at the high end of usage?
Related Posts
- Better Rotating Outages
- Pandemic Gas Mystery
- California November 2020 Propositions
- California, I can save you billions with a small and reasonably priced computer program...
- California November 2016 Propositions
(Published to the Fediverse as: California Climate Credit #etc #gas #electricity #climatechange #california Why do I get a California Climate Credit? This is the worst possible way to fight climate change. Do something smarter California! )
How to Save a Planet (with an Infiniti QX55)

I've been meaning to check out the new Gimlet/Spotify podcast, How to Save a Planet, and finally listened to the first episode about wind power last week.
It was sponsored by the Infiniti QX55.
This is not even a hybrid. It's a 268 horsepower SUV. Consumer Reports says:
"The company cited 26 mpg combined (city and highway) when the QX50 was introduced for 2019. We measured just 22 mpg overall in our tests, putting it on par with larger, more powerful SUVs. And it required premium fuel. Subsequently, the official EPA estimate was downgraded to 25 mpg."
It's not even a particularly efficient SUV. You are really unlikely to be saving a planet this way. I'm not sure I can bear to find out who sponsors the second episode. I'm imagining a subscription panda steak service or bitcoin.
I shouldn't throw stones. I bought into a Volkswagen clean diesel (which came with a green tax credit before they got busted). I currently drive a Land Rover that can only hit it's claimed mpg if the engine stop technology is working. That only happens for about twelve miles after it has been serviced, which feels like the same sort of scam as the Volkswagen frankly.
Or maybe the clue is in the indefinite article and they read my post about extreme environmentalism.
Related Posts
- New Podcast Business Model: Less Content
- Reviews for January 2023
- Extreme Environmentalism
- Reviews for June 2023
- Subscription Economics
(Published to the Fediverse as: How to Save a Planet (with an Infiniti QX55) #etc #climatechange #environmentalism #podcast You're not really helping to save the planet if you're helping Infinity to sell more QX55's. )
Global Temperature Anomalies Animation, 1850 to 2018
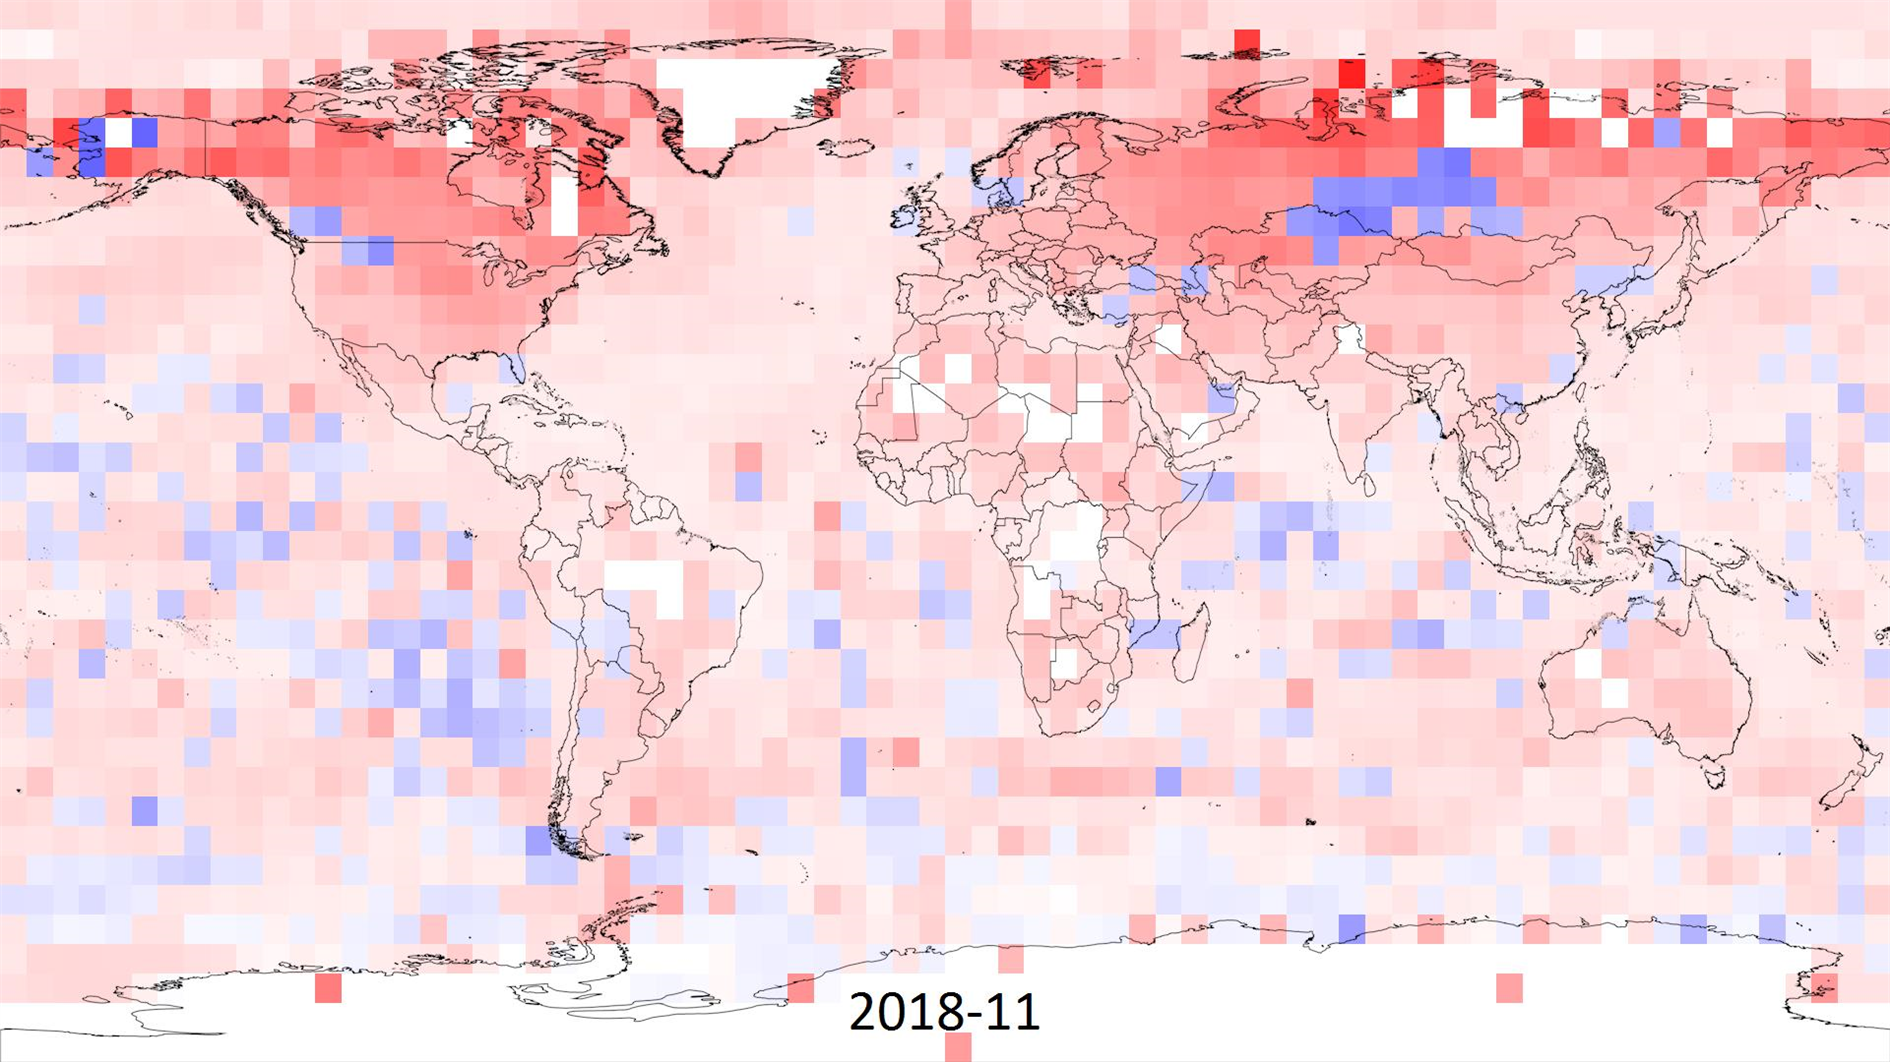
I made this animation to visualize climate change based on the HadCRUT 4 data (specifically the ensemble median gridded data) from the Met Office Hadley Centre.
HadCRUT 4 provides temperature anomalies in a five degree grid by month and year from January 1850 to November 2018 (as of this post). Anomaly here means deviation from the 1961-1990 average.
In the animation I wanted to capture the full timespan of the data but also show long term trends. Each frame is a month of data and each five degree grid of longitude and latitude is colored based on the maximum cumulative anomaly (positive or negative) for each decade. The range for color is 0 to +/- 20.85 degrees, red for warmer and blue for cooler. This means there is a reset at the start of each decade, the first few years are mostly random noise but by the end of each decade you're seeing the range of extremes.
Spoiler alert - you can spot something happening in the last three decades.
As well as the change in temperature it's interesting to watch the increase in global coverage over time. It's surprising that even the most recent years have no readings for Antarctica. Here's a paper (PDF) discussing the impact of the missing data. The HadCRUT 4 FAQ has more detail on how the temperature anomalies were assembled.
Related Posts
- Animation of a year of Global Cloud Cover
- Daily Average Global Cloud Cover Animation
- Global Cloud Cover 48 Hour Video Updated Hourly
- Coronavirus Visualization Update
- 4K One Year Global Cloud Timelapse
(Published to the Fediverse as: Global Temperature Anomalies Animation, 1850 to 2018 #timelapse #animation #climatechange #environmentalism #video Animation of maximum cumulative temperature anomaly by decade from January 1850 to November 2018 based on the HadCRUT 4 data set. )